This post in a three minute nutshell
Union County created a direct primary care option for its health insured employees. There were two particularly salient features: the monthly DPC fees were extravagant; and the county sweetened the DPC option with cost-sharing reductions (CSR) for downstream care. Despite CSR, the DPC clinic was able to reduce ED utilization; but, evidently because of CSR, specialist utilization rose sharply. Overall health care expenditures, including the monthly fees, for DPC employees rose relative to that of non-DPC employees by about $30 PMPM.
The program was actuarially analyzed in two separate reports, Brekke’s and Milliman’s. Brekke was aware of the extravagance of the fees, but ignorant of the CSR. Thus, her actuarial methodology systematically failed to compensate for most of the measurable effects of the CSR in increasing expenditures, making the clinic itself appear more of a failure than it actually was. Her blindness to CSR led Brekke to atttribute an increase in overall program costs to the operation of the clinic. But that increase had largely been wrought by CSR.
Milliman flipped the script by being aware of the CSR, but ignorant of the extravagance of the monthly fees. Their actuarial methods compensated for nearly all the effects of the increased expenditures resulting from CSR, assuring that these did not contribute significantly to an an unfavorable evaluation of the clinic. On the other hand, their ignorance of the actual monthly fees ($96 PMPM) coupled to their choice to estimate those fee as an “actuarially reasonable” $61 PMPM resulted in the clinic looking less of a failure than it actually was. Milliman’s miscalculation made an actual loss of $30 PMPM look like a break-even proposition.
Moreover, Team Milliman went on to claim that, by a unique methodology, the team had been able to “isolate the impact of the direct primary care model” from the CSR and from the bargain struck for the monthly fee. They purport to have determined that “the model” had performed its part fairly well, reducing overall health services utilization by nearly 13%.
But that significantly higher fee allowed the clinic to provide a greater quantum of services, like same day visits, to its small patient panel. High contact/easy access/small panel is the engine that drives DPC performance. By assuming that the results delivered by a lavishly funded clinic were representative of “the model”, Milliman did the equivalent of road-testing a Corvette and ascribing its performance to a Miata. In short, it’s bullshit.
The full post of 10K words may take an hour; it goes deep into the weeds. An Executive Summary (900 words; 5 minute read) appears a the end of this post.
Introduction: Mistakes Were Made
Relying on deeply flawed studies and strained interpretations, as recapped here and elsewhere, Nextera and Paladina (now known as Everside) still brag that their respective “school district” and “county government” direct primary care option programs for employer health care plans produce huge overall health care cost savings. 2024 saw publication of two university doctoral dissertations centering attempts at rigorous, quantitative studies of direct primary care selection and cost savings — one to address each of these vendor’s “poster-child” programs. Now-Dr David Schwartzman concluded that savings in claims costs fell short of offsetting the school district’s investment in Nextera’s DPC monthly fees. More sensationally, however, now-Dr Gayle Brekke concluded that total medical service expenditures for Union County plan members enrolled in Paladina’s DPC rose by ($107 PMPM), which was more than the amount the county had paid in monthly DPC fees ($106 PMPM).
The Schwartzman and Brekke dissertations were only the second and third studies of direct primary care performance to show even a modicum of actuarial competence. They were preceded by a 2020 case study, also of the Union County program, produced by a team from Milliman Actuaries.
Schwartzman’s findings of the more moderately severe failure of DPC to perform rest on very firm ground. And Brekke’s result is not as portentous as it may seem; her seemingly outlandish results likely reflect questionable employer decisions more than they reflect worse-than-useless primary care delivery at the county’s direct care clinic.
In this post, I assess both Dr Brekke’s disseration work and the Milliman study. I have addressed Dr Schwartzman’s study in a separate post.
Paladina’s poster child for its brand of a direct primary care option is offered to municipal employees of Union County, NC, as an option within its employee health benefits plan. In her focus on that county’s DPC clinic, Dr Gayle Brekke’s dissertation work in health policy at the University of Kansas Medical Center relied on difference in difference (“DiD”) methods similar to the DiD methods in David Schwartzman’s study of the Nextera clinic. Dr Brekke’s 2024 study was not the first in-depth, quantitative, and essentially academic study of that same clinic. In May of 2020, the Society of Actuaries presented an actuarial case study of the Union County program by a team from Milliman Actuaries. The Milliman report was the first actuarially serious report on direct primary care,
Brekke concluded that “DPC increased expenditures” by $107 per member per month (“PMPM”). When certain additional controls were applied, Brekke’s computed increase reached $152 PMPM. Yet, for the cohort she had studied, Union County paid an average of $106 PMPM in DPC membership fees. If even the more modest $107 figure for increased overall expenditures is valid, lower total spending could have been attained if, rather than introducing its DPC option program, Union County leaders had set $106 PMPM on fire and left its employee health care offerings unchanged. Did Brekke’s study demonstrate that a $106 DPC fee was actually worse than completely useless?
Brekke also concluded that “DPC increased specialist visits”. By the end of her study period, Union County DPC members had nearly doubled their average utilization of specialist visits. But, in the largest ever survey of DPC physicians (about 150 responders), a study that was in fact a component of the Milliman-prepared report that also presented Milliman’s case study of the Union County program, only 1% of DPC physicians with prior FFS experience reported doing more specialist referrals than they had as FFS physicians, while 85% reported doing fewer specialist referrals. It is hard to image a DPC clinic that doubles its member panel’s specialist visit rate.
So what did Brekke miss? For reasons I now set out length, I find it likely that the heightened utilization, especially of specialist visits, by DPC members was largely the result of an employers’ decision of which Brekke was, inexplicably, unaware. Union County had coupled DPC enrollment to significant, DPC-members-only, cost-sharing reductions (“CSR”) for downstream care. Even the most cost-effective direct primary care clinic can only do so much to reduce the demand for downstream care when that demand is stimulated by sufficiently heavy downstream care cost discounts.
Milliman’s metholodogy, on the other hand, compensated for somewhere between most of and all of the expenditure increases that resulted from the cost-sharing reductions . So, in seemingly better news for direct primary care advocates, Milliman’s report indicates that the direct primary care program resulted in a modest reduction in overall health care spending, $2 PMPM, about 1%, essentially a break-even proposition.
Reader convenience note, for those who may read the primary source material. The Milliman report was largely directed toward employers, and centers its most comprehensive conclusions on the difference in employer-side health care spend resulting from the direct primary care program. To facilitate comparison with Brekke’s study, which centered total, rather than employer-side, health care spend, I have adjusted Milliman’s computed $5 PMPM increase in employer spend to a $2 PMPM reduction in total spend, to account for Milliman’s estimate that a net of $7 PMPM in cost-sharing moved, under the DPC program, from member spend to employer spend. See Figure 12 in the Milliman study at lines H and I.
But correcting only a single assumption by Team Milliman drives that near-break-even result about a third of the way toward Brekke’s more extreme result. Milliman’s computations were based on estimated average monthly DPC fee of $61 PMPM. Simply replacing that assumption with the actual average monthly fee that appears in the publicly recorded contract between the parties — $96 per month (for the Milliman study’s subjects) — would bring the putative annual net change in health care spend wrought by direct primary care from an overall cost savings of $2 PMPM to an overall cost increase of $33 PMPM.
But Team Milliman went on to claim that, by a unique methodology, they had been able to “isolate the impact of the direct primary care model” from the CSR and from the bargain struck for the monthly fee. They purport to have determined that “the model” had performed its part remarkably well, reducing overall health services utilization by nearly 13%.
But a significantly higher fee allows a significantly smaller patient panel, and small panel size is the engine that drives DPC performance. In effect, Milliman road-tested a Corvette and ascribed its performance to a Miata. In short, it’s bullshit.
The Union County DPC clinic came nowhere near breaking even. A very significant share of responsibility for a huge loss falls to the inability of the DPC clinic to produce downstream care cost reductions commensurate with the especially steep monthly DPC fee to which the County had agreed. Union County’s decision to offer substantial cost-sharing reductions exclusively to DPC members also seems to have cost the county dearly.
Brekke did not know that the direct primary care plan she was studying came with cost-sharing reductions. Milliman put Union County’s monthly DPC fees at two-thirds of the amount the county actually paid, which the Milliman analytical team could have found in publicly available county documents. It is tempting to outright reject any work product from Brekke or from Milliman, but it seems to me more informative to harvest what we can from the Brekke and Milliman reports, and move on.
Fortunately, there is a fair measure to harvest. None of the misconceptions I have identified so far, from either Brekke or Milliman, necessarily compromised either the actual claims and enrollment data on which they drew or the accuracy with which they applied their choices of standard actuarial modeling tools to that data or the accuracy of their account of the processes they followed. The Milliman firm are accredited health care actuaries. Brekke herself was an accredited actuary when she entered her doctoral program in health policy; now she is no less than an “FSA, PhD”. Everyone makes mistakes and comes to misconceptions. Correcting error, we can still hope to draw — from the hard work of Brekke and Milliman — explanations of the data that are more accurate and more useful than their own.
Brekke’s methodology systematically under-compensates for certain risk-factors, which explains some of the gap between the two studies.
Milliman compared costs and utilization for DPC members with those for non-DPC members using a “participant vs participant model”; they used a proprietary “MARA Rx” concurrent risk score methodology to compare the cohorts. In a concurrent model, each population’s predicted claims costs and utilization for the study period is determined using data from the same study period. Concurrent models are used by actuaries to estimate the expected costs for a given time period resulting from both chronic and acute conditions present during that period.
There are also “prospective” risk scoring models that de-emphasize acute conditions; these models are primarily designed for predicting future costs. The Milliman Team report relied, instead, on a concurrent model because its goal was to compare populations during a given historical period.
Among concurrent models, “Rx-concurrent” models have scoring based on member ages, member sex, and member usage of different therapeutic classes of prescription drugs (hence “Rx”) during the study period being assessed. (There are also prospective models which we need not address here.) The therapeutic drug classes are used to mark the likelihood of the presence of particular chronic or acute conditions or groups of such conditions so that expected costs and utilization for the studied period can be determined. Rx models are often used in place of more comprehensive, diagnosis-based (“Dx) models (or others) when, as in the Union County case, certain classes of medical claims data are unavailable or incomplete.
I do not have access to the technical details of Milliman’s proprietary “MARA Rx” classification scheme. I assume that it is similar to that developed at Johns Hopkins for its ACG® risk measurement suite. Relevant features of the ACG® Rx process are set out in Chapter 3 of its technical manual, an item serendipitously available on-line. ACG® uses “Rx-defined morbidity groups”; 20 of these address acute conditions. Of those 20, six acute morbidity groups are identified as having high impact on risk scores, including infections, acute major toxic and adverse effects, severe pain, pregnancy, delivery and female infertility (the latter arguably “chronic”, but presumably treated as if it was an acute issue connected to concurrent efforts to attain a pregnancy).
For some of the acute conditions, like infections, incidence is largely randomly distributed between cohorts typically compared, so each cohort risk score is similarly affected. But there are acute conditions that are, as explained in a Society of Actuaries issue paper discussion of concurrent risk adjustment, “not necessarily random and can contribute to adverse selection”. If, for some reason, Union County women planning to give birth or to address their infertility had disproportionately selected DPC membership, a concurrent Rx methodology like Milliman’s would have raised the relative risk for the DPC cohort, and produced a more suitable, and more favorable, risk-adjusted assessment of the impact of direct primary care on claims costs.
Although the Milliman Team ultimately relied on a concurrent model, it had collected some preliminary data, reported here, that included a tentative comparison of relative risk scores of DPC and FFS cohorts under either an Rx-concurrent model (reflecting both acute and chronic conditions) or an Rx-prospective model (de-emphasizing acute conditions). That comparison showed that the relative risk of the direct primary care cohort grew modestly when acute conditions were considered, indicating that the DPC cohort had a higher share of medically significant acute conditions.
On the other hand, Brekke’s “difference-in-difference”, a.k.a., “pre-post cohort” actuarial model was not controlled for disparity between cohort utilization arising from the treatment of non-random acute conditions. Brekke’s process involved identifying DPC members and comparing their own cost and utilization before and after the introduction of DPC. In other words, she compared members to themselves, “pre” and “post”. The difference in costs and utilization for non-DPC members was also established, and used to adjust for “trends” to which both groups are subject. The difference between the “treatment group” difference over time and the “untreated group” difference over time — the difference-in-difference — is taken as the effect of the DPC treatment.
In using one time period to predict results in a future time period, a pre-post “DiD” analysis can reflect chronic conditions that existed in both time periods. Insofar as it is a comparison of a cohort full of members to their own prior selves, it can be very good at controlling selection bias springing from chronic conditions. But, in regard to acute conditions, DiD more closely resembles prospective risk-adjustment than it does concurrent risk-adjustment. (Caveat: directly comparing “DiD” and risk-adjustment has an apples-to-oranges problem and may cause headaches.)
Despite not being as well controlled as Milliman’s methodology in the way described, Brekke’s methodology is nonetheless generally “consistent with actuarial practice for estimating financial impact”. In fact, the phrase just quoted comes from the Milliman authors themselves, in a piece that granted Milliman Consultants’ prestigious actuarial blessing for the Union County DPC provider itself to assess direct primary care cost-savings using a version of DiD methodology (one that was , in fact, far weaker than Brekke’s) for the provider’s self-study of the same Union County data addressed by Brekke and Team Milliman.
The difference-in-difference method can and typical does incorporate a wide range of additional controls, and typically does so in an academic setting. Brekke undertook a few such controls, one of which is discussed later in this post. But none of Brekke’s additional adjustments addressed acute conditions.
For acute conditions that are randomly distributed among members of either plan and between pre and post periods, Brekke’s claims data may have been noisy, but not necessarily skewed. But if the claims data reflected non-random acute conditions, the complete absence of an apt control would have left Brekke’s analysis more vulnerable to adverse selection than Milliman’s analysis. For example, if for some reason, Union County women members planning birth or pursuing in vitro fertilization or other fertility services had disproportionately selected DPC membership, Brekke’s actuarial methodology would have produced a less accurate, and less favorable, assessment of the impact of direct primary care on total claims costs.
Under the corrected take on the Milliman study I offered above, Union County’s program would have been scored as increasing costs by $33 PMPM. Brekke found a far worst result. Milliman’s more successful adjustment for nonrandom acute conditions can account for a portion of the gap between Brekke and Milliman.
As hinted, part of the gap could be down to concurrent election of DPC and treatment for pregnancy and female infertility, which is often desired, quite expensive, and medically elective. And, while birth cycle issues may be particularly susceptible to adverse selection, ACG®’s Rx-based risk rating system looks at twenty other morbidity groups based on acute conditions. Each morbidity group has some potential for a fortuitous concurrence of imminent elective treatment and the opportunity to grab the cost-sharing reductions available only to DPC enrollees.
In sum: because her methodology systematically fails to account for some of the utilization that may arise from DPC cost sharing, Brekke’s adjustments to DPC utilization were inherently too low. This is but one of the reasons why the Union County program looks worse in Brekke’s analysis than in Milliman’s.
When it comes to induced utilization, the failing was mutual.
To the degree that cost-sharing reductions resulted in adverse selection, Milliman was able to risk-adjust and Brekke destined to miss the mark. And because Brekke was unaware of cost-sharing reductions she was similarly destined to miss any opportunity to adjust the data, her process, or her conclusions to account for induced utilization. Induced utilization adjustment predicts how differences in benefit generosity results in different utilization by plan members, even when the members are identically risky or have been randomly assigned to plans. Induced utilization and adverse selection are, in the present case, separate results of the same cost-sharing reductions.
As mentioned earlier, despite the Milliman authors’ knowledge of the benefit structure and choice of a methodology that was able to compensate for some adverse selection to which Brekke was blind, Team Milliman’s principal report itself failed to address, and its computations did not compensate for, induced utilization. This, they have told us, was their deliberate choice.
Like other programs, Paladina’s Union County program provides direct primary care to DPC members free of deductibles or other cost sharing for primary care services; as far as I know, no employer DPC program has done otherwise. But programs take different tacks on cost-sharing for downstream care. Some come tied to cost-sharing increases, i.e., higher cost-sharing for DPC members’ downstream care than is faced by their FFS counterparts. Others, including the Union County DPC program, are tied to downstream cost sharing reductions exclusive to DPC members.
Either approach to downstream care cost-sharing for DPC can be rationalized. Higher cost-sharing for DPC members can move money from member pockets to an employer’s treasury, a hedge against a direct primary care clinic’s failure to reduce downstream medical spend by an amount sufficient to offset a high monthly DPC fee. As an added bonus, increasing cost-sharing for DPC members would also tend to muffle their utilization of downstream care, a second piece of a rational health care cost control program.
On the other hand, lower cost-sharing for DPC members that shifts costs from employee to employer might simply appear to be an employer blunder. But it might also be a strategic choice, a component of a rational, high-risk, high-reward attempt to get the most value out of direct primary care by attracting heavy utilizers into the clinic where DPC-style cost-reduction magic can take place. It is not clear what considerations actually prompted Union County’s choice of cost-sharing reductions for DPC members.
Whatever their intent, cost sharing differences tend to push members with high health risks toward selection of the more generous of competing plans. Even without cost sharing differences, methodologies that take account of that effect are as essential in studies of direct primary care as they are in countless other studies of health care cost analysis. Albeit with differing scope and levels of success, both Brekke and Milliman addressed adverse selection.
“Induced utilization” presents a related avenue to increased total health care costs when DPC members receive exclusive downstream care cost-sharing reductions. All else equal, DPC members with lower cost-shares will more heavily utilize downstream services than FFS counterparts who pay more. Even when sound actuarial methodology might perfectly adjust claim data for status differences between FFS and DPC cohorts, the failure to adjust claims data to reflect demand induced by DPC-only cost-sharing reductions will result in an underestimation of DPC effectiveness.
Milliman’s published study neither explicitly addressed nor deliberately adjusted for induced utilization. Weeks later, after having been prompted on the issue, the Milliman team added a footnote to an informal discussion of their report indicating that the level of induced utilization was “slight” and that exclusion of an induced utilization adjustment had been both deliberate and justifiable, presenting a more conservative estimate of DPC effectiveness.
Brekke’s doctoral dissertation had also omitted any explicit consideration of induced utilization because, as already mentioned, Brekke had somehow come to believe that the Union County DPC and FFS plans had identical benefits for downstream care.
When it comes to induced utilization, the failing was mutual.
There are clear signs that the cost-sharing structure contributed significantly to the failure of the Union County program to reduce overall health care costs. Blind to the cost-sharing changes, Brekke sought other explanations for the dismal Union County results. Inter alia, Brekke joins me in pointing out Paladina’s extraordinarily high DPC fees. But, in seeking to account specifically for the statistically significant increase in specialist visits under DPC, while unable to proffer either adverse selection or induced utilization as an explanation, Brekke also proposed some novel, thought-provoking theories, which I will discuss a bit later.
Next, however, are some of the specifics of Union County’s generosity to DPC members.
How generous were the cost-sharing reductions Union County granted to DPC members?
Milliman estimated that the DPC plan’s cost sharing reductions transferred an average of $7 PMPM from plan members to the county. But hard facts are available that Milliman might have done well to dig out. The precise difference in cost sharing for all non-primary care services and for FFS cohort primary care could have been directly determined from the claims data on a member by member, claim by claim basis. Although determining the same for services at the clinic may still have required estimation, available harder data revealing actual cost sharing figures for, say, specialist visits would be relevant in assessing the role of induced utilization in the increase in specialist utilization reported by Brekke.
While hard retrospective data would be a valuable addition, we still have useful basic information about Union County cost-sharing that helps us imagine the utilization decisions Union County plan members faced.

Figure 1 illustrates the contours of Union County’s cost sharing for single, adult members of both DPC and FFS cohorts. DPC members face zero cost-sharing for primary care; for downstream care they face a $0 deductible and a 20% coinsurance up to a coinsurance maximum of $2000; the effective maximum out-of-pocket amount (mOOP) for DPC members is $2000 That is the sum of the $2000 coinsurance maximum and the $0 deductible.
FFS members have a more complicated, “kinky” scheme. There are two deductibles; one runs form $0 to $150 of total medical expenses; the second begins at $900 and continues to $1500. The deductibles are like the bread in a sandwich; in between them, the employer pays 100%. When claims, including primary care claims, have reached $1500, the county and member will have paid $750 each. Beyond $1500, FFS members pay 20% coinsurance up to a maximum of $2000; the effective maximum out-of-pocket amount (mOOP) for FFS members is $2750. That is the sum of the $2000 coinsurance maximum and the $750 in split deductibles. For a tabular presentation of the cost sharing plans and other information, please see my Union County cost share Detail Page .
In broad, simplified strokes: DPC members always pay 20% or less of the medical service costs they incur; FFS members get the 20% rate above $1500, but their responsibility for the first $1500 of spend can be as high as 50%; the bad-year worst-case mOOP scenario for FFS members is always $750 worse than that for DPC members.
The cost-sharing scheme favors DPC members at nearly all levels of annual utilization, save a minor anomaly (never worth more than $30 per year to an FFS member, see Detail Page). At the $1000 level of annual claims, the DPC advantage is a relatively modest $50 per year. But from that point upward the DPC advantage grows sharply, providing meaningful rewards to the heavier users — the users that matter most to Union County’s bottom line.
Peak DPC advantage reaches $750 annually where the FFS plan mOOP sets in just below $14,000 of annual utilization, and remains fixed at that level for all heavier utilizers. But even for far more moderate users, all the way down to $1500 annual total utilization, the annual savings for DPC enrollees will be at least $450 annually.
The potential for $450 to $750 savings could justify a member in selecting DPC, but using the clinic solely for routine matters while paying cash, generated by hundreds of dollars in cost sharing reductions, to a non-clinic PCP for any non-routine matters. An example of a generic, modest, but savvy user “gaming the system” in that way is developed on the Detail Page.
“You need the money. So take the DPC option. Let the clinic do the routine stuff. Come see me when it really matters, and I’ll give you a cash payer discount.”
DOCTOR WELBY
Another scenario, alluded to above, is the coordination of direct primary care enrollment with treatment for birth cycle events like maternity care, delivery, and IVF. Expected expenditures are well above mOOP level. If a woman who used no other services were to begin a birth cycle of care with $1500 worth of services in one benefit year and delivery in the following next year, DPC membership would bring $1200 of cost sharing reductions.
Cost sharing reductions of that size might have palpable effects.
The cost-sharing reductions appear to have had palpable effects.
Union County’s direct primary care clinic opened its doors to DPC members in July of 2015. The effects of the DPC-only cost sharing reductions were felt even earlier, beginning in the final quarter of the 2014-2015 health benefits cycle.
Typically, health plan claims expenditures grow throughout the plan year, surge in the final months, and drop precipitously when the plan year turns over, reflecting the familiar annual cycle of cost-sharing thresholds, especially deductibles and, maybe less so, mOOPs. Union County’s abolition of all deductibles for DPC members and effective reductions of mOOPs beginning with claims for services received on or after July 1, 2015 certainly seems to have disrupted the normal cycle. Since, the county’s commissioners approved the DPC option in the third quarter of the 2014-2015 plan year, most prospective DPC plan members had ample new incentives to postpone visits and procedures to the new plan year.
This table compares the overall utilization per member per month for Union County health plan members in the final quarter of the year before and the year of DPC implementation. All members were in the standard FFS plan during the prior year. Members whose figures are shown in the two data columns are classified by whether they switched to the DPC plan when it became available.
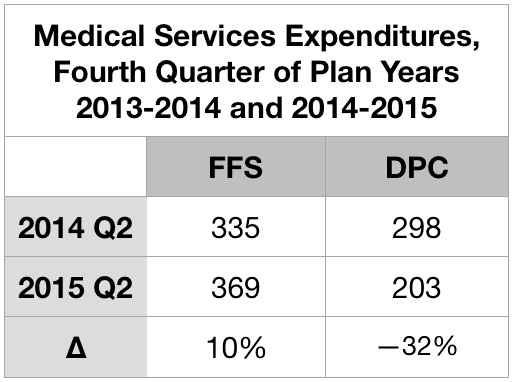
Those who signed up to join DPC on July 1 skipped the second quarter surge in 2015. Instead, they plunged.
Note. Brekke includes the markedly low figure given above for overall expenditures for DPC patients from the second quarter of 2015 as one of six quarters she averaged to established the “pre-treatment” level of expenditures for her difference-in-difference analysis. Doing so lowers her “pre” level average by roughly $20 PMPM, which in turn raises Brekke’s estimate of the overall increase in expenditure associated with the DPC program by that same $20 PMPM. Also, note, to avoid artifacts owing to annual deductible (and/or mOOP) cycles, some actuarial investigators (including the Milliman team that investigated Union County) insist that data be selected to accurately reflect the experience of all parts of a full annual cycle; for many purposes, it is usually considerate acceptable for data to be drawn from two different plan year, provided the data covers twelve continuous months. Brekke’s six month “pre” period included one full year plus an additional third quarter and an additional final quarter, both of which are typically high usage quarters. This further drives Brekke’s and Milliman’s estimates of DPC effectiveness apart.
Specialist utilization showed strong sensitivity to cost-sharing reductions
The typical deductible-driven cyclical pattern, and what happened to it under the Union County DPC plan, is best illustrated in Brekke’s data on specialist utilization set out in Figure 2. For reference, the average specialist visit rate for non-elderly residents of the United States at the time the study concluded was roughly 100 per 1000 patient-months. For the FFS cohort, the cyclical pattern is evident from five peaks in every plan year’s final quarter (three of them after implementation of DPC) and five valleys in every plan year’s first quarter.
The DPC cohort data is very different.
After the clinic opening on July 1, 2015, specialist utilization rose rapidly at first, and continued to rises, albeit less rapidly; eventually the rate roughly doubled the national specialist visit rate. En route to that startling destination, the valleys were shallower, the three peaks following the quarter in which DPC is first implement were more modest, relative to their valleys. Also, the peaks had shifted to the third quarter of the plan year; they now reflected health care need (increased sickness in the winter months) rather than the deductible cycle.

Most interestingly, the DPC cohort data showed a utilization valley in the last quarter before DPC was implemented and a peak during the quarter which began with the arrival of DPC. Figure 3 zooms in on that time period.

This, of course, is a reversal of the normal deductible-driven cyclical pattern, but it is precisely what is to be expected when an imminent abandonment of deductibles is scheduled for a date certain. For the record, the DPC cohort data did not show a peak in second quarter of 2014. Even allowing that the data may be a bit noisy, the simultaneity of data reversal and policy reversal at mid-year 2015 seems far more than a coincidence. In any case, Brekke’s raw data for only the post-period showed DPC specialist visit frequency to be higher than that for FFS, with high statistical significance (p < .0001), even without an adjustment to compensate for the lower risk score of the DPC cohort.
Brekke, Spin #1: “Increasing specialist utilization is not a bug, it’s a (DPC) feature.”
In her 2016 article for the Health Watch newsletter of the Society of Actuaries, Direct Primary Care: Good for What Ails Us, Gayle Brekke enthusiastically reported that:
A British Medical Journal study of Qliance found that DPC patients experienced significantly better outcomes than similar patients who received primary care in the traditional way. Qliance DPC patients experienced
- 35 percent fewer hospitalizations
- 65 percent fewer emergency department visits
- 66 percent fewer specialist visits (emphasis supplied)
- 82 percent fewer surgeries
But there never was a British Medical Journal study of Qliance and, by 2015, Qliance had itself refuted those claims with a study pressing far more modest (if still commendable) cost reductions claims, including a 14% reduction in specialist visits. No matter what the case, Brekke’s dissertation made quite clear her surprise and distress that her own data on specialist visits was diametrically opposed to her priors.
Because Brekke is a frank, almost Messianic, advocate for direct primary care, her concluding, then publishing, that DPC caused a large increase in overall expenditures and, specifically, in specialist utilization is a testament to her integrity. At the same time, however, her messianism might be borne in mind as we examine how she came to end her discussion of specialist utilization claiming that “it is not possible to draw conclusions about whether the increase in specialist visits that is found in this study reflects positively on the practice’s efforts (emphasis supplied).”
Brekke’s principal spin on increased specialist visits began with this: “Importantly, families that enrolled in the DPC option were required to change primary care providers.” She posits this as a sort of artifact that interacts with positive aspects of DPC practice to produce a surge of specialist visits upon the launch of Union County’s DPC.
Brekke asserts that “at any primary care practice, new patient visits include a comprehensive exam and history”. While the quoted language certainly overstates the case, let us stipulate that it probably true (a) that visits by relatively recent enrollees at any primary care practice are more likely to see a comprehensive examination and history than less recently enrolled patients and (b) with Union County’s DPC practice beginning with 100% new enrollees, members of the clinic cohort would be more likely to see a comprehensive examination and history than either those in a concurrent cohort of FFS patients or (in a pre-post analysis) than their own prior selves as pre-DPC members then-served by FFS practices.
Brekke continued to the core of her argument: “Specialist referrals are more likely to be generated by a new patient visit than by an established patient visit.” Through that critical assumption, Brekke links enrollment in the DPC clinic to increased specialist utilization. Her line of argument seems plausible at first blush, and Brekke proposes that “future studies” should explicitly address the mechanism she has proposed.
Such future studies aside, another way to advance this line of argument is to search the literature for evidence on whether new patient visits (or something similar) are indeed more likely to generate specialist visits. So far, my literature search has come up empty — despite having carefully read, several times each, every single word of three articles that Brekke offered to support her argument, “Hill 2003“, “Baker, Bundorf et al. 2014“, and “Schaum 2013“. None of those three references seems to me to address, even tangentially, whether new patient visits (or something similar) is particularly likely to generate specialist visits.
In her introductory chapter, in connection with an earlier citation the Schaum piece just mentioned, Brekke had suggested that increases of utilization following DPC enrollment may arise from discovery of unrecognized needs and pent-up demand for care due to poor access or poor doctor-patient relationship prior to selecting the DPC option. Brekke’s data on plan selection did show that those who selected DPC were less likely to have met her criteria for having had a “usual source of [primary] care” during the pre-period before the clinic existed. However, a special additional control used in her DiD analysis of specialist visits using the same “usual source” variable also showed that the DPC cohort members most likely to visit specialists were not those previously underserved, but were those who already had a usual source of care before the clinic existed.
Still, it remains plausible that the July 2015 delivery of a fresh cohort of members into a brand new Union County direct primary care clinic might have led to somewhat of a surge of comprehensive exams and histories (I call them “Welcome to DPC visits”), in turn leading to somewhat of a surge of specialist visits. At the same time, however, it seems fair to infer, that such a surge should abate within a reasonable period of time.
Conveniently, Brekke’s data follows a stable “full analysis cohort” of DPC enrollees from a full year pre-enrollment through up to thirteen quarters after enrollment. In Figure 2, above, we see that the specialist utilization by direct primary care users began to surge immediately on plan implementation in July of 2015 and seems to still be on a still upward trending path three full plan years later.
By the end of the third quarter of operation, as the clinic reported to the county, 73% of DPC members had already self-reported improved health since joining DPC and that the annual rate of clinic visits exceeded three per member. At that rate, the average DPC member patient would have had six visits before the end of the second plan year; the percentage of the cohort yet to receive some version of a Welcome to DPC visit should have substantially abated. Yet, their specialist visit rate did not abate; to the contrary, in their third plan year of DPC, cohort members visited specialists fourteen percent more often than they had during their first two plan years.
Although Brekke did not specify the relationship between the comprehensive examinations she has in mind and typical preventative annual physicals, it should also be noted that Milliman found — somewhat surprisingly — that DPC members received a statistically significant lower level of preventative physician services, driven in large part by fewer preventative annual physicals.
Of course, Dr Brekke’s proposed future studies might put a finer point on her “new patient” gloss. In my opinion, her existing study makes clear enough that Welcome to DPC visits made no more than a very modest contribution to the surge of specialist utilization by DPC members. By 2017-2018, third plan year, the members of this stable cohort were visiting specialists at roughly twice the rate both of their own pre-DPC selves and of the average US patient of like age. There is no way that “reflects positively upon this practice’s efforts.”
Brekke, Spin #2: “th[is] DPC company may not prioritize reducing specialist visits.”
When a DPC practice is contracted with an employer to provide primary care services to a portion of their employee and dependent population, they may focus more on preventing expensive services such as emergency department and other hospital services, and less on preventing specialist visits.
Gayle Brekke, Dissertation, cited above.
Or might it be that primary care capitation creates an incentive for primary care physicians to refer their patients to specialists even for services they might perform themselves, as noted in studies of primary care capitation by the Urban Institute, the Millbank Memorial Fund, and others?
As a general matter, there is not much daylight between the primary care that prevents ED visits, hospitalizations, or other “more” expensive services and the primary care which “prevents” specialist visits. Primary care preventative visits prevent future problems that may require more expensive non-primary care of all kinds. Primary care sick visits prevent worsening of conditions and so avoid future problems and expensive non-primary care of all kinds; the same applies when a PCP takes a telephone call or text message to triage a possible urgent or emergent case. Slack scheduling of office visits facilitates access for same day/next day sick visits; even when DPC doctors are merely schmoozing the last patient, they contribute to the structure of access that helps the next same-day primary care patient avoid a worsening condition and expensive non-primary services of all kinds. The same applies when she is out on the golf course, off to Europe, or asleep at home, but staying available for telehealth.
The only sense in which there is a choice to be made “preventing” specialist visits and “preventing” other downstream care services is that there is a financial incentive, baked into capitation models, to stint on services that might be, but need not be, pushed off to specialist physicians. Unfortunately, the same work costs more when diverted to specialists than when performed in a primary care setting. Operationally, Brekke’s suggestion that “this DPC practice did not necessarily incentivize fewer specialty visits” is mashup of tautology, apology, and euphemism. A better translation from the original Messianic is, “This DPC decided to shirk.”
Given her priors, I suspect that had Brekke been aware of the benefit structure, she would have gleefully, and in my opinion correctly, attributed the increase in specialist visits to the DPC-only cost sharing reductions, and refrained from euphemism, from overly creative explanations, and from the conclusion that “DPC increased specialist visits.”
And, no matter the benefit structure, there are additional reasons to doubt that direct primary care increases specialist visits either in general or in this specific case. As to the particular case, the Union County plan gave the clinic doctors minimal incentive to shirk. That clinic was supported by extraordinarily high DPC fees, over 55% greater than the national average reported in the massive survey conducted by Milliman and the AAFP for the Milliman report. The patient panel size, for the two physicians, averaged 466 members compared with an average actual DPC panel size of 445, per the aforementioned survey, and an average “target panel size”of 628. The contract between the vendor and the Union County actually authorized a panel size as large as 800 patients. If any direct primary care clinic would have been able to pursue multiple strategies for constraining health care expenditures concurrently, this was the one.
The clinic was paid enough to be simultaneously able to walk the walk of easy access and to chew the gum of performing, rather than diverting, services that might have been diverted to specialists.
Perhaps of equal importance, that gum is delicious.
Brekke herself, citing and quoting Starfield, Shi et al. 2005 , tells us that “[p]rimary care is comprehensive ‘to the extent to which primary care practitioners provide a broader range of services rather than making referrals to specialists for those services.'” It involves “the provision of care across a broad spectrum of health problems, age ranges, and treatment modalities”. (Bazemore et al. 2015, cited by Brekke). And compared to traditional large panel, short-visit, high volume FFS primary care practices, direct primary care practice can fight PCP burnout by providing better opportunity for PCPs to “practice at the top of their license” and “utilize the full extent of their education, training, and experience” (Rajaee, 2022). A well-known DPC thought leader Dr Kenneth Qiu 2023 has expressly, and with obvious pleasure, linked the broadened scope of care made possible in a DPC practice with the movement of care delivery from specialists to direct primary care physicians. Another well-known DPC thought, Dr Jeff Gold, has personally described to me the pleasure he takes in performing services that large-panel FFS physicians typically are constrained to refer to specialists.
To borrow a phrase, DPC attracts primary care physicians who want to be all that they can be. The most rewarding part of any given DPC doctor’s day may well be seizing the moment to do what Brekke calls, “preventing specialist visits”. DPC physicians get to enrich their professional and personal experience and reduce health care costs at the same time.
The Union County physician staff was not driven to “focus less on preventing specialist visits”.
I conclude that neither a welcome visit feature of DPC nor an inexplicable bug causing the county clinic to focus “less on preventing specialist visits” played more than a modest role in to the increase in specialist visits seen in Union County DPC program. The by-far largest share of the observed increased in specialist visits by DPC members was probably the result of the county having lowered DPC members’ cost-sharing for specialist visits.
By the way ..
The Milliman case study did not report on specialist utilization. In their report, the Milliman authors stated that the medical claim data they had been given “was not well populated with provider specialty codes. Without this data, we were unable to consistently distinguish between primary care and specialist physician office visits and thus were unable to assess the impact of DPC on physician specialist utilization rates.” Credit Dr Brekke’s perseverance.
Milliman’s finding of 36% lower ED utilization, before risk adjustment, is considerably more favorable than seen in other studies.
Milliman reported enormous ED savings, enough to account for nearly half of all the downstream care savings that Milliman attributed to the Union County clinic. Milliman’s ultimate (albeit incorrect) conclusion that the Union County DPC program was a near break-even proposition at a $61 PMPM turned on ED savings singlehandedly offsetting almost one third of even that deeply underestimated monthly fee. That’s the rough equivalent of preventing one $1000 – $1500 ED trip for one in every five DPC members each year. That’s a big deal and worth a close look, especially because it is quite a bit more favorable than Brekke’s findings on ED utilization or than the reported experience of other direct primary care clinics.
Both Milliman and Brekke presented actuarially adjusted estimates of emergency department visits. Milliman found a statistically significant risk-adjusted reduction of 41%. Brekke found an adjusted percentage reduction of 20%, which fell short of statistical significance. Less than one-quarter of the final gap can be explained by differences in actuarial methodology. Before adjustments, Milliman says that the DPC population had 36% fewer ED visits than their FFS counterparts. Brekke’s data puts the unadjusted reduction in ED visit rate at only 15%.
Even Brekke’s post-adjustment 20% percent reduction in ED visits, post adjustment, is high compared to that observed in David Schwartzman’s dissertation study of the “school district” employer DPC option run by Nextera, a Paladina competitor. His DiD study found that the studied employer option program had nearly trivial effects on annual ED utilization (which he had measured by ED expenditures), averaging less than $45 per employee member per year over the three year study, which corresponds to roughly an 8% reduction in visit numbers. Unfortunately, the Brekke, Milliman, and Schwartzman studies are really the only studies of direct primary care clinics with both plausible controls for population health differences and an adequately accounted methodology for data collection.
While they lack risk-adjustment, two studies of direct primary care clinics stand out from other work in giving a somewhat credible account of unadjusted claims data, including ED visit counts, they had actually examined. One is Nextera’s self-study of the same clinic studied by Schwartzman, a report that accords well with his dissertation; it yielded an unadjusted ED utilization reduction of 9%. The other somewhat credible report came from the aforementioned Qliance, a competitor of Nextera and Paladina. Their 2015 report described a plausible data gathering process and a large multi-employer cohort size and reported an unadjusted 14% reduction in ED utilization.
Specifically mentioning ED utilization reductions, the Milliman report identified two studies of concierge practice as being both actuarially solid and possibly relevant to direct primary care. One was a two-year study of an elderly population that showed adjusted annual ED reductions of 20% and 24%, the other a three-year project (adult, non-elderly population) showed adjusted annual reductions that never exceeded 11%.
Brekke’s finding of an unadjusted 15 % reduction stands mid-pack among all credibly reported ED savings claim for small-panel practices. Milliman’s finding of an unadjusted 36% reduction in ED utilization stands well apart from other credible report. As there is no direct evidence of error on the part of either, the importance of ED utilization to the entire Union County DPC story begs further effort to explain why Milliman and Brekke differ. Still, the presently available evidence indicates that Brekke’s measure of the unadjusted reduction in ED utilization by DPC members are more credible than Milliman’s.
The risk adjustment Milliman applied to its raw ED data makes some sense, but is at least somewhat too large.
As distant as Milliman’s raw ED utilization figures are from other accounts, Milliman adjusted them in an interesting way that increased that distance. For services other than ED services, Milliman had risk-adjusted the raw utilization numbers for DPC members upward to compensate for the relatively good health of DPC member. For ED visits, however, Milliman risk-adjusted the number of ED visits by DPC members downward, which would tend to compensate for the relative poor health of the same DPC.
By most measures, the DPC cohort was less medically risky than their FFS counterparts; overall, the DPC/FFS relative risk score under the MARA Rx methodology was 0.917, so on average Milliman adjusted raw utilization and expenditure figures upward. Not so for ED utilization, however, as Milliman’s Rx concurrent risk adjustment process indicated that the otherwise-healthier DPC cohort had the greater risk of requiring ED services.
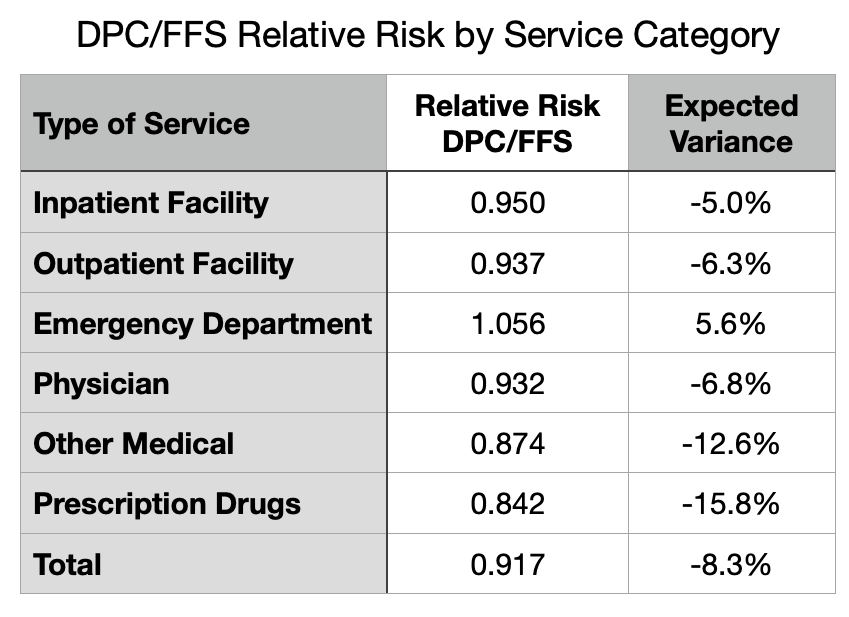
Although the MARA Rx overall risk score showed 8.3% lower utilization for the DPC cohort, that score was composited from separate scores for six different service categories as shown in Figure 4. For five of the six categories, the DPC cohort had an expected utilization between five and sixteen percent lower than the FFS cohort. For ED services, however, there was a large upward deviation so that DPC members were expected to use 5.6% more ED services than FFS members.
MARA Rx concurrent risk are based on each cohort member’s age, sex, and their use of certain classes of prescription drugs that predict morbidities that align with utilization of various medical services. There is a 20% surplus of children in DPC. Children (when neonates are included) are healthier overall, and tend to lower the overall risk level of the cohort. But they have a similar frequency of ED visits to working age adults. So the age differential between the cohorts may contribute to the observed pattern. The excess of children in the DPC cohort means lower relative risk overall for most medical services, but does not lower the the DPC cohort’s relative risk for ED visits.
The other demographic factor used MARA Rx, sex, is probably not a factor. Milliman’s report was silent on the male/female ratio in the cohorts, but Brekke’s enrollment data make clear that DPC had slightly more males than females. Since females tend to somewhat higher ED rates than men, the DPC cohorts propensity for increased ED risk runs counter to this bit of demographics.
As to the actual medical data, as opposed to demographic, data that fuels Rx-based risk adjustment, a stand-out finding of ED risk suggests that the DPC cohort, despite not actually going to EDs as frequently as their FFS counterparts, may have been using an unusually large share of the particular prescription medications that MARA Rx takes as indicating the morbidities that are predictive of ED use. Antibiotics, strong pain killers, and antipyretics are heavily used in EDs.
The results of Rx-based risk adjustment might also have a serendipitous component. Although there are over 900 DPC patients, cohort-wide higher use of the drugs that portend any particular set of morbidities could be the serendipitous result of the idiosyncratic prescribing habits at the clinic. While FFS members have dozens of PCPs from which to choose, the clinic has only two. This could render Rx-based concurrent risk assessment for the DPC cohort vulnerable to chance, as individual doctors are known to vary considerably in the frequency with which they prescribe antibiotics and opiate pain relievers.
Now image a well-run primary care practice that strategically leverages high access, including 24/7 telephone triage, to respond to acute problems while diverting unnecessary ED visits. I suspect such a practice would imitate the way an ER disposes of similar cases: antipyetics, opiates, antibiotics, discharge to home with watchful waiting. At the same time, consider that easy access to primary care with no cost-sharing invites clinic visits — and, therefore, prescriptions — for the kinds of common acute maladies that the FFS cohort might self-manage with over-the-counter medications. In fact, per Milliman, on a risk-adjusted basis, the utilization of all prescription medications for DPC members slightly exceeded that for FFS members.
But finally, notice that the process just described suggests how increased utilization of the health care system induced by cost-sharing differences in itself is likely to raise the relative concurrent risk score of members of the more generously treated cohort. Given that Union County’s DPC members had more generous cost-sharing, Milliman’s risk-adjustment of their ED utilization figures was at least a bit too large.
In sum, Milliman’s applied a somewhat too large risk-adjustment that magnified unadjusted ED utilization numbers that were already far larger than those in Brekke’s study of the same clinic and than those in five other reasonably credible other studies.
For many years after Qliance itself had refuted its own prior study, DPC advocates flogged the wild claim that the prestigious British Medical Journal had shown that Qliance had reduced specialist visits by 66% and ED visits by 65%. In early 2015, Qliance’s busted both figures down to 14%, then later went bankrupt. While some DPC advocates still flog the gaudy unamended Qliance numbers, the more sophisticated DPC advocates have updated to a claim that the prestigious Milliman report to the Society of Actuaries showed that DPC reduces ED visits by a risk-adjusted 41%.
I have no doubt that small-panel, easy-access, 24/7, primary care can reduce care costs in a variety of ways, but most particularly through the mechanism of triaging acute conditions to avoid unnecessary ED visits. At or below some specific level of monthly fees, a direct primary care clinic may be able to pay for itself with lower overall utilization. But even assuming the complete accuracy of Milliman’s application of actuarial methodologies to the Union County claims, it is clear that the average monthly direct primary care subscription fee of $96 PMPM actually paid in Union County had not come near to being low enough to result in net savings.
But what of the adjustment that Brekke never thought of and that Milliman never undertook, the one for induced utilization?
Making an induced utilization adjustment will show the Union County direct primary care clinic in a more favorable light.
As previous noted, although the Milliman Team compensated for the effects of the benefit structure by addressing selection effects, their report left the job incomplete by failing to address induced utilization. After receiving some criticism for that omission, they opined that the cost sharing reductions were modest and omission of an adjustment was mostly harmless. See Milliman’s What Our Study Says About Direct Primary Care. Milliman takes its study as having proven that the direct primary care model could save money. Omission of an upward adjustment to DPC efficiency to compensate for induced utilization, the Milliman Team assured, had merely resulted in a conservative estimate.
Knowledge that he Milliman Team sharply under-estimated the resources by the clinic, shifts expectations downward and changes the omission of an adjustment for induced utilization from a conservative assumption that left Milliman’s proof of the DPC principle intact to an aggressive assumption that may unfairly exaggerate DPC inefficiency, perhaps even depriving DPC of being found cost-neutral or even better.
In the circumstances, Team Milliman should revisit their conclusion that the cost sharing differences were indeed “slight”. Milliman’s estimation of the difference in benefit value had not been careful. For instance, the model presented in their report addressed neither the $750 cohort difference in mOOPs nor the waiver of the 20% coinsurance for primary care; including both will about $8 PMPM to their $7 PMPM estimate of the net difference in the cost shares (see the cost-sharing details page). Precise adjustment for induced utilization can be challenging especially if, as appears the case here, cost sharing difference may have simultaneously increased utilization and increased relative risk scores. Also, Milliman might be able to test the actual claims data to confirm whether their models of the different cost-sharing schemes actually perform as they had estimated. After more carefully estimating the impact of the cost-sharing rules, Team Milliman might determine that effect of induced utilization was now worth including.
Per the Milliman report, data from a large proprietary database of employer health plan claims support an estimate of $10 PMPM for specialist visits of a typical member of an employer FFS plan. If I am somewhat correct that cost-sharing reductions have a big hand in the near doubling of specialist visits that Brekke reports, then an induced utilization adjustment for specialist visits and other economically elastic services might run in double digit dollar PMPMs. Even if slight, an induced utilization adjustment of the claims data will move the putative break-even level of monthly direct primary care subscription fees higher.
My guess: had Milliman fully and accurately completing the actuarial work, the news for direct primary care would have improved, but not by enough to get near the additional $33 PMPM that would support a claim that a $96 PMPM Union County clinic was cost effective.
Cost effective direct primary care may be an impossible dream.
Based on its measurement of the performance of a clinic that it mistakenly believed to be funded at $61 PMPM, Team Milliman reported that amount as an actuarially reasonable monthly fee that would render DPC a break-even proposition. But it is doubtful that a clinic funded at $61 PMPM can produce the same quantum and quality of primary care and, thereby, achieve the same results, as the $96 PMPM clinic Milliman actually studied.
This is not actuarial science, it’s just arithmetic. To raise the same revenue, a $61 PMPM clinic would have to increase its patient panel size, slashing the amount of time each PCP can spend with patients by 37% Instead, the clinic operator could offer a sharply lower compensation package to clinic physicians. But you get who you pay for and, if it proves nothing else, Milliman’s work shows that two PCPs summoned to a lavishly funded $96 gig could barely make the right music.
Small-panel, high-touch, concierge-light direct primary care may be a nice way to reward yourself, your family, and your employees, a luxury item. Cost effective small-panel, high-touch, and concierge-light direct primary care may prove to be impossible.
Bonus
Brekke was a member of the advisory panel for Milliman’s project. Brekke and one of the Milliman report’s principal authors made a joint presentation on direct primary care to a Society of Actuaries meeting in mid-2019; her co-panelist presented preliminary results of the Union County study. The Milliman report came out in mid-2020, the first actuarial study of direct primary care. In mid-2023, Brekke defended her dissertation. Brekke’s dissertation contains hundreds of citations. The Milliman report is neither cited nor acknowledged in Brekke’s dissertation.
Executive Summary
This post examines two actuarial case studies of a single direct primary care clinic in Union County, NC. One study was by a large actuarial firm (Milliman) , the other by a former corporate actuary now active in DPC advocacy (Brekke). Brekke’s conclusions indicate that the clinic was a colossal failure at reducing overall costs. Milliman’s report suggests that the clinic was roughly a break-even proposition. My conclusion on the reports is that each of them is a patchwork of skillful work, blind spots, misjudgments, errors and omissions. I attempt to salvage the maximum insight possible from the successful bits of their hard work. My conclusion on the clinic is it was a smaller failure than Brekke suggests, but that it did fall well short of breaking even.
County plan members could elect to receive primary care either on a traditional fee for service basis or at the direct primary care clinic. Those who chose the clinic also got a sweetener from the employer – cost-sharing reductions for downstream care. Brekke did not know that. When her raw data indicated that DPC members were using downstream care at a high rate she attributed that result to poor clinic performance rather than to county generosity for non-clinic services.
Milliman’s major mistake had the opposite effect; it led them to over-rate clinic performance. Milliman underestimated (at $61 PMPM) the monthly DPC fees (actually $96 PMPM) by over one-third. Milliman’s approach indicates the clinic increased overall expenditures costs by $33 PMPM, an eye-catching loss. Yet Brekke puts the loss at over $100 PMPM, off the charts.
Milliman also claimed that, by a unique methodology, they had been able to “isolate the impact of the direct primary care model” from the CSR and from the bargain struck for the monthly fee; they purport to have determined that “the model” had performed its part fairly well, reducing overall health services utilization by nearly 13%. But since this was not a $61 clinic, but a $96 one, that part of Milliman’s work was equivalent to road testing a Corvette and ascribing the results to a Miata. In short, it’s bullshit.
Brekke’s methodology, but not Milliman’s, systematically under-adjusts for instances of adverse selection based on non-random acute conditions, as when a member joins DPC in anticipation of a pregnancy and delivery.
Neither Brekke’s nor Milliman’s studies adjusted for the related phenomenon of induced utilization, the difference in utilization that would result if the same member(s) were simply moved between cohorts. On this point, both Milliman and Brekke underestimate DPC efficiency.
The ability of cost-sharing reductions to drive choices depend on their size. In this case, we are looking at $450 potential annual savings for relatively modest users of healthcare services, and $750 in savings for every user hitting $2000 or more of total utilization.
That cost-sharing reductions had a palpable effect is apparent in Brekke’s month by month accounting of expenditures and, especially, of specialist utilization. For example, after the effective date of the county’s abolition of deductibles for DPC members, their utilization of specialists no longer tracked the familiar pattern of specialist visit numbers rising as the end of an annual plan period approaches, then diving a day later.
Unaware of cost-sharing reductions, Brekke developed other rationales to account for the increase in specialist visits. One thought was that this was a result of new first visits that unlocked pent-up demand from previously underserved patients. That idea was belied by some of her own data, primarily that data which showed that the increase in DPC member specialist visits did not moderate in later years. Her second idea is best understood as a polite accusation of shirking — DPCPs sending patients to specialist for services that could be equally well performed by a PCP. Given the lavish funding of this particular clinic, and strong incentives to the contrary, shirking seems unlikely.
In the other study, Milliman did not address specialist visit data.
Both Brekke and MIlliman did address ED utilization. Per Milliman, DPC reduced ED utilization by a statistically significant risk-adjusted 41%. Milliman’s ED utilization figures were the principal driver of its claims of DPC success. Brekke saw a much smaller reduction, one not statistically significant. Comparing their raw unadjusted findings, Brekke’s figures, though far lower than Milliman’s, are very much in line with all other credible studies. With risk adjustment, the difference for ED utilization grows and pulls Milliman even farther out of line from other studies.
Neither Brekke’s and Milliman’s risk adjustment methodology would have captured the full impact of the cost sharing reductions on ED visits or any other utilization. Neither contained any adjustment for induced utilization. Any adjustment that more accurately addresses the impact of the cost-sharing reductions would put the clinic in a better light, but it is unlikely that an induced utilization adjustment would be anywhere near large enough for this $96 PMPM DPC to break even.
Had Union County agreed to a $61 monthly fee, Milliman’s analysts assume that $61 would have bought the same quantum and quality of primary care as the real life county received for the $96 it paid to the real life clinic vendor; that assumption is unwarranted.
