If I were a direct primary care practitioner, I’d be only mildly miffed at Milliman’s reducing what I do to a series of CPT codes. But I’d be furious that Milliman’s team set the value of my health care services at $8 PMPM.
The $8 PMPM figure Milliman declared as the health care service utilization to deliver all DPC-covered primary care services to DPC patients was based on apparent underreporting, by the studied direct primary care provider, of a single class of data: the quantum of primary patient care actually delivered to DPC patients.
Although this data was of central importance and would have warranted a validation process for that reason alone, Milliman evidently took no steps to validate it. But there were clear warning signs warranting extra attention, including the employer’s public reports — known to the Milliman team — that DPC patients were visiting the DPC clinic about three times a year. Indeed, in a different part of its DPC report, Milliman itself used $23 PMPM, not $8 PMPM, as a representative value of the DPC covered primary care services delivered by FFS-PCPs to their patients, whom DPC practices regard as vastly underserved.
Correcting the $8 PMPM to something reasonable shows that Milliman has wildly overstated net savings associated with DPC.
Note: Original post of 6/11/2020. Text of post updated 08/13/2024.
The resources used by direct primary go beyond what is recorded in CPT codes. DPC docs and advocates used to be the first to tell us that. Here’s a DPC industry leader, Erika Bliss, MD, telling us “how DPC helps”.
A large amount of DPC’s success comes from slowing down the pace of work so physicians can get to know our patients. While it might sound simplistic, having enough time to know a patient is fundamental to providing proper medical attention. Every experienced DPC physician understands that walking into the exam room relaxed, looking the patient in the eye, and asking personal questions dramatically improves treatment. [Emphasis supplied.]
https://blog.hint.com/what-qliance-taught-me-about-healthcare
Slower-paced and longer visits use real resources. As do all the other elements claimed to generate DPC success, such as same day appointments, nearly unlimited access 24/7, extended care coordination. Historically, a principal justification for the subscription payment model has been that too much of the effort required for comprehensive primary care escapes capture in the traditional coding and billing model.
The Milliman report found no net cost savings to Union County from the money it spent on its DPC plan, a negative ROI. But some DPC advocates seek salvation in Milliman’s claim that application of its novel “isolation” model to Union County’s claims data turns that lemon into lemonade.
That model is described below. Amazingly, it was based on CPT-coding of primary care services delivered at Union County’s direct primary care clinic.
[T]he DPC option was associated with a statistically significant reduction in overall demand for health care services(−12.64%).
Milliman report at page 7.
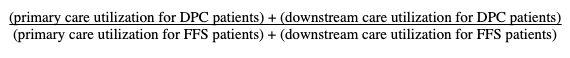
As noted, that computation marks overall demand reduction across the system, in which lowered downstream care demands are measured as part of all demanded health care services including the health care services demanded by direct primary care itself. This involves a comparison like this:
Lemonade by Milliman — initial steps.
Downstream care utilization for both DPC and PPS patients, along with primary care utilization for non-DPC patients was assumed to be represented by the County’s paid claims. Milliman, in other words, felt it was actuarially sound to use the employer’s negotiated fee schedule as applied to CPT codes as the appropriate yardstick to measure health care services utilization for three of the four variables in its comparison.
But DPC providers are not paid on a claims basis; they are paid on a subscription basis for nearly unlimited 24/7 access, same day appointments, long, slowed-down visits, extensive care coordination and the like. How then is the “utilization” of direct primary care services to be determined? Is there anything comparable to Union County’s negotiated fee schedule for fee for service medical services that might fit the bill for subscription primary care ?
How about Union County’s negotiated subscription feee for the direct primary care service from the DPC? That figure averaged $95 PMPM. Had that number been used in Milliman’s alternative model to measure utilization of direct primary care at the clinic, I note, direct primary care delivered by the DPC would have been “associated with” a very substantial increase in overall demand for health care services. Milliman, having found that Union County’s ability to negotiate fees was sauce for the FFS goose, did not find that Union County’s negotiating skill was an appropriate condiment for the subscription DPC gander. So, they went a different route.
How about setting the utilization of direct primary services at an approximation of market price for subscriptions to the bundled primary care services of other DPC clinics. Indeed, the Milliman report itself included a market survey that established the value willing patients and willing providers had set in real life exchanges of money for DPC covered services delivered in Direct Primary Care clnincs. Had this figure — $61 PMPM — been used in Milliman’s alternative model, I note, direct primary care delivered by the DPC would still have been associated with an increase in overall demand for health care services.
But, hey, what do markets know?
Milliman went a different route.
A cost approach, perhaps? I expect that Paladina, Union County’s provider, would have declined, if asked, to provide data on the prices it paid for the inputs needed to provide Union County with the contracted direct primary care services. And it could well be that Paladina is as bad a price negotiator as Union County itself.
But these costs can be estimated, and the result would have more general applicability. Assume a panel size of 500, a PCP salary/benefits package of $254 k/yr (about the AAFP-reported average), and overhead at a mere 35% of PCP compensation (versus 60% in insurance based practices). That’s $57 PMPM.
Using a realistic estimate of the actual costs of putting a PCP into a DPC practice as a means of putting a value on the health care services demanded when a PCP is actually put into a DPC practice seems sensible.
But Milliman took a different course.
Breakthrough in Lemonading: the elements of the Milliman method for computing the health care services utilization of the direct primary care clinic in Union County.
- Assume that utilization of subscription-based holistic, integrative direct primary care can be accurately modeled using the same billing and coding technology used in fee for service medicine.
- Ignore that a very frequently-given, explicit justification for subscription-based direct primary case is that the fee for service billing and coding methodology can not accurately model holistic, integrative direct primary care.
- Ignore that direct primary care physicians as a group loudly disparage billing and coding as a waste of their valuable time, strongly resist it, and do not use standard industry EHRs that are designed for purposes of payment, relying instead on software streamlined for patient care only.
- Rely on disbelieving, reluctant DPC physicians, using EHRs ill-equipped for the task, to have accurately coded all services delivered to patients, used those codes to prepare “ghost claims” resembling those used for payment adjudication, and submitted the ghost claims to the employer’s TPA, not to prompt payment, but solely for reporting purposes.
- Have the TPA apply the County’s FFS fee schedule to the ghost claims.
- Carefully verify the accuracy of the FFS fee schedule amounts applied to the ghost claims.
- Do precisely nothing to verify the accuracy of the ghost claims to which the verified FFS fee schedule amounts were applied.
- Perform no reality check on the resulting estimate of primary health care services utilization
- Do not compare the DPC claim cost results to the utilization of DPC services as reported in articles on Union County you have consulted, referred to, and even quoted in the literature survey elsewhere in this same DPC study.
- Do not compare the DPC claim cost results to any one of a number of readilly available, credible reports of average claim costs for primary care services by members of employer health plans, such as the Milliman Healthcare Cost Guidelines (HCGs) — even though another significant part of this same DPC study rests squarely on the Milliman HCGs for determing the value for the average claim costs for primary care services by members of employer health plans.
- Do not compare the DPC claim cost results to the market prices for direct primary care services revealed in this same DPC study’s market survey.
- Do not compare the DPC claim cost results to the price for direct primary care services you have assumed was paid by this employer to its direct primary care clinic.
Anyone see a potential weakness in this methodology?
This methodology resulted in Miliman’s concluding that the rate of the health care services utilization in the direct primary care clinic was $8 PMPM. Table 12, line D. That tiny amount was the number which, when used in Milliman’s alternative model, showed that direct primary care delivered by the DPC was “associated with” a decrease in overall demand for health care services of a 12.6%.
Milliman identifies its methodology as a tidy “apples-to-apples” comparison of FFS primary care services and direct primary care services measured by a common yardstick. But that look comes with the feeling that the Milliman emulated Procrustes, gaining a fit to the iron bed of the fee schedule by cutting off the theoretical underpinnings of direct primary care model.
Many DPC practitioners, however, are bottom-line people who will endure wholesale repudiation of their ideology lurking in Milliman’s study details as long as the ostensible headlines serve up something they might be able to monetize: a supposedly “actuarially sound” demonstration that the direct primary care model saves big bucks.
Milliman’s conclusion that DPC saved 12.6%, however, hinges on the $8 PMPM result being somewhere near accurate. But that puny figure is at war with reality.
Milliman’s finding $8 PMPM for the claims cost of DPC services rendered in the DPC is patently inconsistent with Milliman’s own estimate of the very same thing which appeared just a few pages later in the very next chapter of their report.
After reporting the $8 finding on page 33 in Chapter 6 of its DPC case study of DPC, the Milliman team turned to a “Case Study Generalized Actuarial Framework for Funding Employer DPC Options”. For that analysis, it estimated — based on the Milliman Health Cost Guidelines for 2019 — the employer share (assumed to be 90%) of national average employer plan claim costs for DPC-covered primary care services would be $22.54 PMPM; this corresponds to total claims for DPC-covered primary care services being in excess of $25 PMPM.
Since the $25 figure corresponds to 2019 figures, it is somewhat inflated when compared to the study period (2016) average. Per the annual announcements of the Milliman HCG’s, $25 PMPM would be a little under 10% too high. On the other hand, $8 PMPM is itself too low, by well over 60%.
Could the cohort members in the Union County direct primary care clinic actually have utilized 60% less of primary care services than the average FFS covered employee in the world at large?
Did DPC somehow decrease primary care services utilization? Isn’t a key, even the key, idea of DPC that easy access and lowered cost-sharing increase primary care utilization?
Union County is not a backwater where healthcare might run cheap. It is a wealthy suburb of Charlotte, which in turn is the headquarters of many of the country’s largest banks.
Milliman’s $8 PMPM result defies known facts and common sense — even as it contradicts core values of the DPC model.
Whether for the average patient panel size (~450) reported in Milliman’s survey of DPC practices, or for the specific panel size (~500) for the DPC practice in Milliman’s case study, $8 PMPM ($96 PMPY) works out to less than $50,000 in revenue per PCP per year. That’s not credible.
That Union County DPC patients see their PCP around three times a year is apparent from the public statements of the employer’s then-director of human resources and his successor. And, it’s right there in an article on the Union County DPC program, an article from which the Milliman study’s literature review quoted verbatim. The three visits are said to have lasted at least half an hour, as long as a full hour, and to be available on a same day basis. $96 a year does not pay for that.
Consider also the logical implications of accepting that $8 PMPM yielded by Milliman’s process accurately reflected actual office visit duration and frequency for the DPC population. Per MEPS data, that’s less than one garden-variety FFS-PCP visit per year. In that case, what exactly is there to account for downstream care cost reduction?
Were those reductions in ER visits caused simply by writing “Direct Primary Care” on the clinic door? Were hospital admissions reduced for patients anointed with DPC pixie dust?
What Milliman misses may be “magic”, just not that kind of magic.
It’s the “magic” of hard, but slowed down, work by DPC practitioners. It’s their time spent doing things for which CPT codes may not or, at least, may not yet exist. It’s relaxed schedules that assure availability for same day appointments. It’s that 24/7 commitment. It’s knowing a patient well enough to ask the personal questions that Dr Bliss mentioned. Achieving this level of access demands more health service resources than are captured by the CPT codes for less than a single annual routine PCP visit.
The data set from which Milliman calculated utilization of direct primary care services underreported the patient care given at the clinic.
The only visible path to Milliman’s $8 PMPM figure for health services demand for the delivery of direct primary care is that the direct primary care physicians’ ghost claims were consistently underreported. That’s kind of outcome is exactly what can be anticipated when disbelieving, reluctant DPC physicians, using EHRs ill-equipped for the task, are expected to accurately code all services delivered to patients, use those codes to prepare “ghost claims” resembling those used for payment adjudication, and submit those ghost claims to the employer’s TPA solely for reporting purposes, i.e., as claims not incentivized by any expectation of claims-based payment.
In fact, Milliman even knew that the coding habits of the DPC practitioners were inconsistent, in that the ghost claims sometimes contained diagnosis codes and sometimes did not. See Milliman’s own report at page 56.
Milliman did nothing to validate the “ghost claims”.
Whatever the justification for Milliman’s reconstructing the utilization of direct primary care health services demand from CPT codes collected in these circumstances were, no meaningful conclusions can be drawn if the raw data used in the reconstruction is incomplete. Milliman does not appear to have spent even a single minute to determine whether the key data set — the set of ghost claims — bore any resemblence to the reality of practice in the clinic.
As a result of its apparent failure to capture the true resource costs of DPC-covered services rendered by the DPC, Milliman’s determination that the DPC model reduces overall utilization by nearly 13% is far too high.
Suppose, arguendo, that D-PCPs provide no more services than a typical ESI covered employee receives from typical FFS-PCPs. For $8 PMPM, we might substitute the Milliman DPC team’s own estimate of the FFS claims cost of DPC covered services, about $22.50 PMPM, and then watch the reduction in observed overall utilization fall to about 8%. To the extent that Union County’s D-PCPs actually provided something more than the short, infrequent visits of FFS-PCPs, the savings yield would fall sharply.
On that score, DPC advocates insist that the quantum of care delivered by a D-PCP vastly exceeds that for typical traditional PCP, starting with longer and more frequent visits, and continuing with slack scheduling to assure same-day/next-day appointments and 24/7 access via phone and text message. At $22.50 PMPM, a 500 member panel generates $135,000 per year for, in Milliman’s language, “the overall health care resource utilization” of a one-physician DPC clinic for the 466 members served in each Union County panel.
A plausible estimate of the resources utilization of direct primary care services is the $61 PMPM average market price of DPC services, per the Milliman DPC study’s own market survey. For just slightly less, $57 PMPM, a PCP can serve those 500 patients, earn $254,000 per annum (roughly the 2015 average for PCPs in the local region), while paying a very modest 35% in overhead (versus 60% in typical FFS practices). Substituting a $57 PMPM market price of DPC services for the $8 PMPM at which Milliman arrived would render the impact of direct primary care essentially neutral, so that an employer paying $57 PMPM to a DPC would receive package of services worth exactly that — with neither loss nor savings.
Is $57 PMPM a reasonable estimate of resources utilization of Paladina’s direct primary care clinic, considering that that number is 2.5 fold higher than the primary care utilization of patients in traditional practices (the $22.50 figure cited by MIlliman)? In their own promotional material during the period covered by the Milliman study, Paladina Health traced their success to “unhurried time with a physician whose panel size is an average of 70 percent smaller than a primary care physician in traditional practice”. At that panel size, Paladina’s docs have 3.3 fold more time to spend with patients.
Relying on the associated $8 PMPM utilization level and the resulting computation of 12.6% savings, Milliman’s summative computation of all variables arrived at an overall employer loss of $5 PMPM. Had they used the $57 PMPM figure, the employer’s bottom line would have risen by an additional $36, to a loss of $ 41 PMPM. But don’t forget that Milliman’s report had also understated the monthly DPC fee, by $34 PMPM. Therefore, Union County’s actual losses are quite likely $75 PMPM ($34 + $41). Investing $95 PMPM in DPC is not worse than useless to the employer, but it’s approaching 80% of the way there.
If DPC members utilize merely twice the primary care resources of typical FFS patients, i.e., $45 PMPM, the county’s bottom line would be a loss of a “mere” $61 PMPM.
The guiding principle of the direct primary care option is to entice members to utilize more primary care resources. During the final quarter of the first year of its Union County clinic, Paladina advised the employer that DPC members were seeing patients at a rate of more than three visits per year. Milliman’s having scored that at $8 PMPM of utilization is literally ridiculous.
Using realistic numbers — numbers that accurately reflect direct primary care’s philosophy and claims of increased access — wholly refutes the Milliman team’s core claim that direct primary care significantly reduces overall demand for healthcare services.
