KPI Ninja missed so many boats — a whole fleet really — in its Nextera report, you may wonder whether they come to analysis in good faith. Well, there’s one note in their favor.
Sometimes, KPI Ninja’s inability to make important adjustments disfavors their DPC client. In their analysis of DirectAccessMD, for example, an induced utilization adjustment would have favored their client. Good to know.
One might suppose that KPI Ninja is sometimes uninformed but mostly just eyes-deep in confirmation bias. But, surely, not bad faith?
I mean, it’s not like KPI Ninja falsely told the world that it conducted risk score analysis on behalf of Nextera for a school district claims analysis in partnership with the Johns Hopkins’ ACG® Research Team, or anything like that.
In 2015, Qliance still towered over all in the Direct Primary Care Bragging World with its claim of 20% overall cost reductions. Even that, of course, was quite a come down from the extravagant claims previously spewed under the Qliance banner; fond memories still linger of those heady days when the Heritage Foundation drooled over a non-existent British Medical Journal study alleged to have found that Qliance’s patients had 82% fewer surgeries, 66% fewer ED visits, and 65% fewer specialist visits.
Yet, by the middle of 2016, Qliance was toppled; the pages of Forbes proclaimed the attainment of 38% reductions in medical costs by a Qliance rival, Paladina, at its clinic in Union County, NC. By November of 2016, even upstart Nextera Healthcare was bragging its “DigitalGlobe” study at the 25% level. The following month Nextera reached the brag-summit when Paladina’s Union County brag shrank to a still competitive 23%.
In early 2017, while DPC World eagerly awaited a counterpunch from its former leader, Qliance instead went bankrupt. But at least the torch had been passed!
For various reasons, including a bit of good luck, Paladina’s Union County clinic emerged in the three ensuing years as the principal poster child of the DPC movement.
In May of 2020, just as the Union County clinic’s iconic status reached it apogee, the game-changing Milliman study came along, . The tools of actuarial science, risk adjustment most prominently, were brought to bear in an independent study of the cost-effectiveness of a single clinic, and that one just happened to be Paladina’s Union County clinic. The result was not pretty.
The Milliman study essentially kicked to the curb ALL prior DPC cost-effectiveness studies, including both the Paladina and Nextera studies, rejecting the lot for want of proper risk adjustment. In fact, the Milliman study found that after claims cost risk adjustment to account for the health differences between the studied Union County populations, even Paladina’s most current and more modest savings claim of 23% vanished. The Milliman team made plain as day its estimate that Paladina’s Union County clinic program had not produced any significant cost savings at all.
Worse, the Milliman analysis had been wildly over generous to Paladina; it’s conclusion that Paladina’s program was only slightly worse than a break even proposition for the county was based on an estimate of $61 PMPM for the average DPC fee paid by the County. In fact, the publicly available contract between Paladina and the county, makes clear that the average DPC fee paid was $95 PMPM. While DPC supporters had bragged of over $1,000,000 in net annual savings, what the Paladina contract wrought was a net annual increase in the County’s health care costs in excess of $400,000.
The Milliman team also admonished that:
It is imperative to control for patient selection in DPC studies; otherwise, differences in cost due to underlying patient differences may be erroneously assigned as differences caused by DPC.
This admonition might have had a useful, if sobering, effect on direct primary care, if the DPC community were actually interested in advancing the movement based on the proficiency of DPC medical doctors rather than on the shamelessness of DPC spin doctors.
I can honestly say that the previous champions of DPC cost-effectiveness data, Nextera and Paladina, have met this challenge with more than mere lip service. Instead, they mixed fraud and incompetence with that lip service, and raced anew to the top of Mount Brag Bullshit.
A few months after the Milliman report was published, Nextera made the first move, a bold coupling of a brag at the 27% level with a remarkable stunt:
“KPI Ninja** conducted risk score analysis in partnership with Johns Hopkins’ ACG® research team [.]” KPI Ninja’s Nextera study, page 7.
“KPI Ninja brought in the Johns Hopkins research team that has significant expertise in what is called population risk measurement. . . . We took that extra step and brought on the Johns Hopkins team that has this ability to run analysis. It’s in their wheelhouse and they applied that . . . [The] Johns Hopkins Research Team did the risk analysis[.]Nextera presentation at 2020 Hint DPC Summit meeting.
Ah, but:
“We were not directly involved in this analysis.” Associate Director, HopkinsACG.org.
Not only was there no academic team involved in Nextera’s deeply flawed study, there was no risk adjustment actually performed. It was an heroic risk adjustment charade.
When Nextera bragged a 27% cost savings sporting both fake academic robes and fake risk adjustment, imagine how alarmed competitor Paladina – still reeling from Milliman’s conclusion that risk -adjustment brought the Union County savings down from 23% to 0% – would have felt, if they took Nextera at its word.
Don’t fret; knowing the truth of Milliman, Paladina understood at once that all they had to do was launch their own charade.
Paladina, on its website, moved in January of 2021. After its own lip service to risk adjustment and its own lavish praise of the Milliman study, Paladina’s spin doctor went on to declare that “Paladina Health’s Union County client, the employer case study featured in the Milliman report, also prospered from adopting the direct primary care model. . . . Union County taxpayers saved $1.28 million in employee health care costs . . .. 23% . . ..” No matter that the Milliman team had actually exploded that very conclusion when it concluded that the County had barely broken even.
And, as noted above, the reality is that the Paladina adventure cost the county $400,000 more per annum than the Milliman team had assumed. The net size of Paladina’s deception is over $1.7 million dollars.
Consider, too, the sheer misrepresentational brilliance of the Paladina webpage’s careful selection of two raw data apples and two risk-adjusted data oranges drawn from four of each in Milliman’s basket.
Paladina is okay with using risk-adjusted data, or not – depending only on which choice cuts in Paladina’s favor.
But wait. Paladina’s spin team wasn’t quite done. Six months later, they went ahead and matched Nextera’s invocation of academic work from Johns Hopkins that never took place by invoking academic work from Harvard that never took place. With Paladina newly rebranded as Everside, the spin team trotted out a “white paper” that, in addition to repeating their misrepresentations of the Milliman study, relied substantially on additional findings, favorable to the DPC model, from ” the Harvard DPC cost study”.
There was no “Harvard DPC cost study”. There was a Harvard study of the effect on insurance based fee for service providers of receiving PMPM payments to supplement feefor service payments. That study did not address, or even mention, direct primary care practices that eliminate FFS payment and rely on membership fees.
Technical query. Given that Nextera ventriloquized Johns Hopkins and Paladina ventriloquized both Milliman and Harvard, is it still “Charades”’?
Instead of racing to the top of Mount Bullshit, why not stick to calm, truthful analysis that reveals direct primary care’s actual ability to reduce the costs of care?
[**] KPI Ninja is an “analyst” that has a special division dedicated to compiling brags for Nextera and other DPC companies. See here for more on KPI Ninja.
Montana’s last governor twice vetoed DPC legislation. He was not wrong.
Over the last month or so, DPC advocates from think-tanks of the right have trotted out the proposition that direct primary care could be “the key to addressing disparities in health care access in underserved areas of Montana facing severe shortages of primary care”. They are very excited that eight DPC clinics have “opened” in Montana in just a few years. Yet, when the very same advocates testified before the Montana legislation, they brought along some real MT DPC docs whose own testimony made it clear that what really happened is that eight existing clinics or practitioners in Montana decided to switch to subscription model care.
And, no doubt, each such D-PCP significantly reduced the size of their patient panel. Typical DPC clinicians brag about reducing patient panel sizes to one-third the size of those in traditional practices. Indeed, some members of the same pack of DPC advocates in the same hearing stressed the glories of tripled visit times.
But reducing patient panels sizes by two-thirds obviously aggravates the problem of primary care physicians shortages.
The most common response of the DPC community has been that DPC lowers burnout, lengthening primary care careers, presumably mitigating that aggravation – to some unknown degree and at some unknown point in the future.
I did some math.
Each PCP who chooses DPC and reduces patient panel sizes by two-thirds would need to triple the length of his remaining career to cover the gap he created by going DPC. And it would take decades to do so.
Assume an average career length of 20 years for a burning out PCP, with retirement at the age of 50. Let’s suppose that DPC makes PCP life so sweet that he works until he is 80 years old.
By the end of those 30 additional years, the equivalent of one-quarter of the patients he left behind by going DPC will still be left in the cold Montana snow.
To fully close the gap his switch to DPC created, he would have to work until he was a 90 year old PCP. The good news is that he would be very experienced; the bad news is that some 90 year-olds might struggle with “24/7 direct cellphone access to your direct primary care physician”.
To supplement the patent insufficiency of this bleak scenario, DPC advocates further argue that DPC will lead to increases in the percentage of young professionals choosing primary care practice instead of other specialties. One of the think-tank “experts” from the Montana expedition has said that “we know” this to be the case, but provided no evidence other than the naked claim “we know”. Is this knowledge, or just speculation? Feel free to put a link to any significant evidence in the comments section below.
Even if there was hard evidence that DPC had shifted or might shift career choices toward primary care, it would still be wise to “be careful what you wish for”. Physician shortages in rural areas are not limited to primary care. To the contrary, there is ample evidence, such as this study from a Montana neighbor state, that rural communities face shortages of specialists that are even more consequential than the shortages of PCPs.
If a potentially gifted surgeon is willing to return to her roots in Whitefish, why turn her into a PCP?
“We used a statistically valid risk measurement tool and determined that there was a a non-Nextera population had a 7.5% difference greater level of risk then our Nextera population. But don’t believe that result, because it was not statistically valid.”
“We reduced inpatient hospital 92.7%. Want to know how great we are? Our statistically valid risk measurement — we changed our minds again so you can count it this time —showed that our DPC population had a 37% higher frequency of the conditions most likely to result in an inpatient hospital admission.”
“Although we used only about $10 million out of nearly $15 million dollars in claims data, trust us when we say that the missing millions can only reinforce our brags.”
“Benefit plans? What benefit plans? We don’t read no benefit plans! We don’t gotta show you any stinking benefit plan!”
In its recent report from KPI Ninja, Nextera Healthcare bragged unpersuasively about overall costs savings and reduced utilization of downstream care services. But they also bragged about the following utilization figures for a group of 754 members for whose primary care they were paid $580,868 in DPC subscription fees over the equivalent of a ten-month [1] study period:
1079 office visits
506 of which included additional in-office procedures at no extra cost
573 visits with no additional procedure
329 telephone visits
1868 text message encounters
To determine whether the amount paid represented a plausible value compared to what might have been spent for the same volume of comparable services if obtained through fee for service primary care physicians, we made assumptions that strongly favored Nextera at every point. For example, although the Kaiser Family Foundation compiled studies that showed, on average, that private pay rates for physician services were 143% of Medicare rates, we set our comparison rates at 179% of Medicare, corresponding to the highest value found in any of the studies Kaiser identified.
We applied that adjustment factor to Medicare rates for the services KPI Ninja had enumerated based on the following, extremely generous, correspondences.
we treated visits to a Nextera clinic in which no additional services were performed as equivalent to “Level 5” Medicare office visit for a group of patients, one-third of whom were new patients (coded 99205) and two-thirds of whom were established patients (coded 99215).
Level 5 is rarely used for FFS office visits, i.e., about 5% of all visits; it assumes long probing visits, typically 40 minutes or more
our choice resulted in treating $264 per PCP visit as the FFS cost for a routine Nextera visit
in preparing its report based on its knowledge of payment rates used by the SVVSD, by contrast, KPI Ninja itself assigned a much lower valuation ($115) to an average PCP visit[2];
we treated Nextera’s average telephone call as equivalent to Medicare mid-level visits with an established patient (99213)
these are standard visit rates for problems up to moderate complexity
99213 is the code most commonly billed E & M code
we treated text encounters as the equivalent of Medicare e-visits performed asynchronously via patient portals (G2012)
these type of visits typically cover exchanges via portal for up to a week and require significant subsequent engagement in response to a patient inquiry
many of what KPI Ninja scored as “text encounters”, as actually delivered, would likely have fallen short of G2012
for example, KPI Ninja’s scoring rule would have counted three texts spread beyond 24 hours as two separate “text encounters”; with a spread of up to a week this would have been a single G2012
similarly, KPI Ninja’s scoring rule counted a simple text to, e.g., request a prescription refill request as a “text encounter”; a G2012 would not have been allowed for such a minimal activity
we treated those visits to a Nextera clinic in which additional services were performed as the equivalent of visits to an urgent care center costing an extreme $528.00, the equivalent of two level five visits
In short, we bent over backwards to try to find higher cost correspondences to cast Nextera in a good light.
With these profoundly generous assumptions in Nextera’s favor, the private-pay fee-for-service world would still have delivered these or better services – the 40 minute visits, the phone calls, the asynchronous messaging, the in-office tasks like suturing and making arm casts – at less than the amount Nextera received. Computations here.
What’s more there is no data in the KPI Ninja/Nextera report that actually demonstrates that Nextera delivered more primary care to its members than they would have had under the fee for service alternative studied in the report. Over a dozen times in an eighteen page report (falsely claiming major cost savings for Nextera plan members), KPI Ninja expressly attributes spectacular results to Nextera patients receiving a greater quantum of primary care.
But Nextera did not present any measurement of the amount of primary care received by members of the competing FFS plan. And there is good reason to think that non-Nextera patients from the control group used in the Nextera-KPI Ninja report received plenty of primary care. Instead of Nextera membership, the competing plan’s members received other benefits, including a $750 HRA providing first dollar coverage. That’s more than enough to cover the quantum of care Nextera actually delivered.
Face it. Nextera’s brand of primary care is no big deal, not really much above average. Nextera patients average 1.65 primary care office visits per year (versus a national average for all patients including the uninsured of 1.51); they get half a phone call every year, and they send or receive three annual text messages[1]. Taking $839 a year for that level of service is not exactly a big deal.[3]Claiming that this is some kind of patient access breakthrough is a new frontier in nonsense.
Nextera’s CEO is an acknowledged DPC leader and co-founder of the DPC Coalition. Nextera has 100+ physicians in eight states and a bevy of employer group contracts. Sadly, the KPI Ninja study of Nextera is direct primary care, putting its best foot forward.
So, now we know where a decade of direct primary care “data” has arrived.
[1] Although the study period covered claims from a one-year period, KPI Ninja included a large number of part-year members in the studied cohort. The figures they presented reflect a membership that averaged only 10.1 months of membership in the study year. Per annum values, when presented in this post, have been correctly adjusted.
[2] This can be calculated from their claims, at page 16, regarding Nextera member savings on primary care visit coinsurance.
[3] Taking in an amount somewhat in excess of the average value of services delivered might be thought of as necessary to facilitate a direct primary care system that, while having only modest value for a large percentage of members in relatively good health, funds the more substantial needs of members in relatively poor health. This is a valuable type of financial service that can be supported by allowances both for added administrative expenses and for a reasonable profit.
That type of arrangements is usually called “insurance” and, in all jurisdictions similar arrangments have been made subject to the will of the people as expressed in law. Under current “insurance” law, for example, administration and profit amounts are limited to 15% or 20%. But even though direct primary care providers collect and pool monthly fees and use the use the pooled fees to fund variable service levels based on differing medical needs, DPC leaders insist that their clinics are not involved in “insurance”.
That move is calculated to permit DPC clinics to capture the profits, but avoid the regulations. Yet, without regulation, expansion of direct primary care would likely unlock a primary care microcosm of all the health economics problems addressed by contemporary regulation, particularly those relating to adverse selection. pre-existing conditions, and moral hazard.
Also note that paying a fixed known price for a basket of direct primary care services does not provide fully meaningful transparency if the contents of the basket can vary depending on the purchaser’s changing health status. Every holiday season, my local rock and gem club offers a $2.00 mystery bag of rocks; the price is known but the bag is opaque. For a meaningfully transparent transaction you need to know both the price of the container and the identify and quantity to its exact contents.
In KPI Ninja’s “SchoolDistrictClaimsAnalysis” comparing claims costs under the Nextera plan and the competing fee for service (Choice) plan, the “Analyst” overlooked two major differences between the plans in how the “SchoolDistrict” pays “Claims“.
Nextera members pay post-deductible coinsurance at a 20% rate and the district pays an 80% share. But for the exact same claim by a member of the competing fee for service plan (Choice member), the split is 10% and 90%.
While both cohorts have the same $2,000 deductible, in theory, only the Choice plan members have access to an employer-paid $750 health reimbursement account that provides first dollar claims coverage, delaying the onset of the deductible and effectively reducing it to $1,250 dollar.
When two claims for exactly the same service rendered can draw different employer payments for Nextera members and Choice members, that difference payment has nothing whatever to do with Nextera’s effectiveness. Yet, the different effective rates at which claims are paid obviously have substantial effects on the total claims amounts for each group. Accordingly, a large part of any difference between the totals for the two groups is the result of SVVSD benefit design, not the result of anything Nextera does that reduces costs.
To accurately reflect only the savings attributable to Nextera, it is necessary to normalize the district’s average payment rate between the two populations. KPI Ninja did not see the need to do this.
Our method for doing this was to estimate and compare the actuarial values of the medical coverage in the two plans using the publicly available CMS actuarial value calculator developed for the Affordable Care Act’s individual market coverage.[**] We arrived at a downward adjustment from Choice plan total employer costs given by a factor of 0.905.
Correcting just this one oversight by KPI Ninja makes a difference of $311 in the overall savings claims, deflating Nextera’s brag by over one-third. See the computations here.
Every one of over two dozen claim cost comparisons in the KPI Ninja report needs this same adjustment (plus others discussed both in other posts at this blog and in the Nextera Manuscript that can be viewed through a menu item above).
A happy by-product of understanding how claims are divided between the district and its employees is that it essentially resolves KPI Ninja’s concerns about not having been provided employee payment data. Once we have put employer payments for the two groups on a normalized scale, the details of how the employer and employee divided the costs of particular claims among themselves is of little or no value in assessing Nextera’s aggregate contribution to overall savings. In other words employee cost-sharing issues need not impair our ability to evaluate Nextera’s performance.
[**] The paired plans have AV of 78.0% (Nextera plan) and 86.2% (Choice plan) , giving a ratio of 0.905. That ratio represents a conservative adjustment of the employer payments reported by KPI Ninja for two reasons. First, the computed AVs include both medical and pharmaceutical claims. For pharmaceutical claims, however, the cost sharing is identical, so pharmaceutical claims (about one-fifth of all claims) play no role in generating the difference. All of the 10.5% overall AV difference is generated from the difference between the paired medical claims, which must therefore be appreciably larger than 10.5%. Also, the study data included claims from two plan years, 2018 and 2019. The 80:20 coinsurance split for Nextera patients applied to 2018. For the 2019 calendar year, for Nextera patients, the district replaced coinsurance with copayments for several selected services, including e.g., $200 for advanced imaging and ED visits and $60 for specialist visits. See SVVSD 2019 benefits guide. We determined the actuarial value of both the 2018 Nextera plan and the 2019 Nextera plan. For 2019, the Nextera plan had an ever lower actuarial value, i.e, the net effect of the 2019 changes was to decrease overall employer payments for Nextera members.
Abstract:The Nextera “study” by KPI Ninja misappropriated the prestige of a Johns Hopkins research team to support its risk measurement claims; relied on an undisclosed and unvalidated methodology for obtaining population risk measurements; obtained highly dubious risk measurement results; and sharply mischaracterized the significance of those results. In the end, because applying even their own risk measurement results would have reflected negatively on Nextera, they never actually performed risk adjustment of the cost and utilization data under study.
It was a charade.
UPDATED, 12/16/2020. View between two rows of red asterisks (**********) below.
Context.
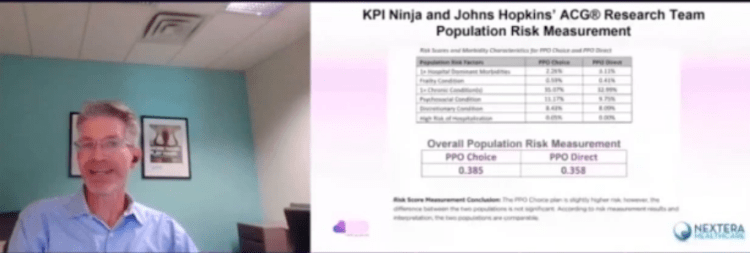
When KPI Ninja’s analysis of Nextera’s SVVSD clinic and the attendent social media blitz first hit the public, Nextera used the following language to misappropriate academic prestige to support the report’s handling of population risk measurement.
“KPI Ninja conducted risk score analysis in partnership with Johns Hopkins’ ACG® research team [.]” Before being sent down the rabbit hole, this language appeared in two prior versions of the study, dated 10.13.20 and 9.22.20 versions of the report. Similarly, a published program of a direct primary care summit meeting noted that, “The case study came together though partnership with KPI Ninja and the Johns Hopkins’ ACG® research team.” In a Youtube video, Nextera’s CEO declares: “[KPI Ninja] brought in the Johns Hopkins research that has significant expertise in what is called population risk measurement”. And on he goes, “We took that extra step and brought on the Johns Hopkins team that has this ability to run analysis. It’s in their wheel house and they applied that [.]” Specifically asked about adverse selection, he went on, “[The] Johns Hopkins Research Team did the risk analysis . . . and that allowed us to get to the $913 [in savings].”
Here’s a screenshot from that video.
And, here is reality.
“We were not directly involved in this analysis.” Associate Director, HopkinsACG.org.
In general, any direct primary care provider should earn some credit for acknowledging the relevance of population health metrics to assessments that compare results between direct primary care populations and other populations. Not here.
In this case, Nextera’s analyst KPI Ninja performatively measured population risk to anticipate criticism, but stopped short of actually applying any actual risk adjustment, even one based on its own measurements, because doing so would have weakened Nextera’s coat reduction claim.
There is no indication that KPI Ninja actually performed a risk adjustment.
Big talk about risk measurement. No actual action.
KPI Ninja computed the risk scores for the two populations at 0.358 (Nextera) and 0.385 (non-Nextera), a difference of 7.5%. The appropriate way to present statistical risk adjustment work is to present unadjusted raw claims data, apply to the raw claims data the relevant calculated risk adjustments and, then present the adjusted claims and utilization data with a confidence interval to assist those using the data in making such judgments as they wish. As the landmark Milliman report on direct primary care for the Society of Actuaries shows, this is done even when presenting differences deemed not statistically significant.
Instead of following standard statistical practice KPI Ninja pronounced the difference “insignificant” and pronounced their own “interpretation” that the two populations were “comparable”, then excused itself from actually applying any risk adjustment to modify the raw claims or utilization data at all, as if no measurement had ever been made. In effect, they treated the data as if their risk measurement had yielded zero difference.
This is nonsense, not analysis. As an initial matter, in common statistical practice with which all analysts, data modelers, and academic researchers (even medical practitioners) should be generally familiar, there are rules for calculating and expressing the statistical significance of differences. KPI Ninja purports to have a crack team of analysts, data modelers, and academic researchers who should know how to do this. What number did they get? Did they bother to determine statistical significance at? They aren’t saying.
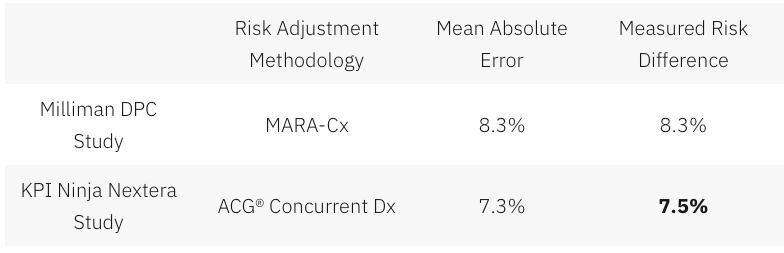
Had KPI Ninja investigated the accuracy of the ACG® concurrent risk scoring model with which they developed the risk scores, they might have run across another Society of Actuaries report, this one entitled Accuracy of Claims-Based Risk Scoring Models; that document would have told them that the mean absolute error (MAE) for ACG® risk group predictions on groups in this size range was 7.3%.
The 7.5% difference KPI Ninja observed was outside that mean absolute error. While this is not ironclad proof the two populations differed, it is certainly substantial evidence of a real difference. If KPI Ninja’s risk measurements have any valid meaning, it is that 7.5% is a significantly more probable measure of the likely population difference than is zero.
In any event, as it is highly probable that these populations differ in health risk, it is deeply misleading to address health risk by declaring that “the two populations are comparable”.
And 7.5% of health care costs is far too large a share to ignore. Consider, again, the Milliman report on DPC for the Society of Actuaries. There, the expert team determined an overall relative risk score difference of 8.3%, and proceeded to apply appropriate risk adjustment to the claims and utilization data. Moreover, the Society of Actuaries study of risk adjustment determined that the risk adjustment methodology used by the Milliman team, “MARA Rx”, had a mean standard error of 8.3%. So, for the Milliman study the measured risk difference merely matched the mean standard error for the risk methodology Milliman selected; for the KPI Ninja study the measured risk difference exceeded the mean standard error for the risk methodology KPI Ninja selected. The case for applying risk adjustment to the data in the Nextera study is, therefore, even stronger than was the case for doing so in the Milliman study.
What was sauce for the Milliman goose, is sauce and then some for the KPI Ninja gander.
In a follow up commentary emphasizing the breakthrough importance of their study, the Milliman team wrote, “It is imperative to control for patient selection in DPC studies; otherwise, differences in cost due to underlying patient differences may be erroneously assigned as differences caused by DPC.” What the Milliman team did not say was, “Measure risk, find a case that needs risk adjustment even more than the one we studied, but omit any actual control for patient selection and deny the need for risk adjustment.”
So why KPI Ninja did substitute “zero adjustment” for the 7.5% adjustment indicated by their own risk measurement. Here’s a clue.
Nextera’s cost reduction brag is pegged at 27%; when deducted from 27%, 7.5% gives a hefty haircut of hundreds of dollars to Nextera’s $913 cost reduction claim.
And being able to keep that trim to collar level would turn on the credibility of KPI Ninja’s own calculation of a 7.5% risk differential. But that effort, KPI Ninja’s first ever reported try at comparing risk between two populations, is not credible at all.
There are substantial reasons to believe that KPI Ninja’s diagnosis-based risk measurements are skewed heavily in Nextera’s favor.
The Nextera population skews heavily toward children; this is entirely predictable, because Nextera employees pay $1600 per year less in premiums to add children than do non-Nextera employees. 24% of the Nextera cohort is less than 15 years old, compared with only 13% of the non-Nextera cohort. On other side of the spectrum, those over 65 were nearly four times as likely to reject Nextera. Upshot: the Nextera population is about 6.5 years younger on average and is less heavily female. Based on age and gender alone, per a landmark data set prepared by Dale Yamamoto for the Society of Actuaries, a risk score difference of about 17% could be expected, even in the absence of adverse selection.
But adverse selection is very much in play in the St. Vrain Valley School District. As described more fully in a separate post, the school district’s cost-sharing structure strongly steers those who anticipate moderate to heavy health care utilization into the non-Nextera cohort with cold hard cash, as much as $1787 of it for a single employee and twice that for a couple. This invites heavy adverse selection that would produce risk scores significantly exceeding those based on demographics alone. Moreover, a comprehensive 2016 Society of Actuaries commissioned report on forty different risk scoring methodologies from eleven different vendors, including ACG®, explained that even the best risk adjustment models are not able to completely compensate for adverse selection.
The mere 7.5% risk difference between the cohorts that KPI Ninja ran across requires that the illness burden data for the two populations severely slash the risk gap indicated by age and gender alone. That suggests a perfect storm of the odd: a surfeit of younger, but relatively sick, Nextera members coupled to a surfeit of older, but relatively healthy, non-Nextera members — all working against a tsunami of adverse selection.
That defies belief, especially in light of widely-reported heavy selection bias at the Nextera clinics in the Longmont area. The report to which I refer was prepared and distributed by a surprising source — Nextera itself.
About two and one-half years before Nextera got its first recruits into the school district employee cohort studied here, Nextera enrolled new members from a similar employee population of an employer in virtually the same town. Nextera’s flagship clinic is near both employers, and employees of both use the same doctors at the same clinics. In its own “whitepaper”, Nextera reported that the employees of Digital Globe who declined Nextera had a prior claims history that was 43% larger than the prior claims history of those who chose the Nextera option.
(Interestingly, in the Society of Actuaries report on risk scoring methodology, a study of the effect of “highly adverse selection” was based on a test population with a claims cost history that was a mere 21% higher than the average. Does that make 43% astronomically adverse selection?)
Did Nextera go, in a mere two and one-half years, from attracting a very healthy population to attracting a still young population now weirdly sick beyond its years?
Or was Nextera simply right in their first big whitepaper, when they identified a heavy selection bias in Nextera’s favor, warranting an adjustment of — not 7.5% nor even 17%, but — 43%.
KPI Ninja’s assertion that the risk difference between the Nextera and non-Nextera populations addressed in the SVVSD report is a mere 7.5%, and “not significant”, is extremely doubtful. As we discuss below, something significantly above 17% is far more likely.
ACG® concurrent risk score measurements, the type attempted by KPI Ninja in this study, are vulnerable to a recognized form of bias that results from benefit design.
As mentioned above and described more fully in a separate post, the school district’s benefit structure strongly steers those who anticipate moderate to heavy health care utilization into the non-Nextera cohort with cold hard cash, as much as $1787 for a single member. Because of a $750 HRA not available to Nextera members, non-Nextera members have an effective $1250 deductible rather than $2000; nonmembers also pay only 10% in coinsurance after deductible, half that paid by Nextera members.
The ACG® technical manual notes that “where differences in ACG concurrent risk are present across healthcare organizations, it is almost universally attributable to differences in covered services reflected by different benefit levels and cost structures”. But, if different benefit designs can produce different ACG® concurrent risk score differences for equally risky populations, might there be occasions when different benefit designs will produce similar ACG® concurrent risk scores for populations that have different levels of underlying risk?
Certainly. A concurrent risk score based on current insurance claims data has no way to reflect the risks of the uninsured, and would less effectively capture the risks of the relatively underinsured. Members in a group with higher cost-sharing will under-present for care relative to a group with lower cost-sharing. If the higher cost sharing group was also the less risky group, this “benefit design artifact” would artificially shrink the “true” ACG® concurrent risk score gap.
This artifact is a corollary of induced utilization, and illustrates why the Milliman authors expressly called for studies of direct primary care to address induced utilization and why CMS’s “risk adjustment” processes incorporate both risk measurements and induced utilization factors.
One particular result of a benefit design artifact would be a discrepancy between concurrent risk measurements that incorporate clinical information and those that rely solely on demographics; specifically, a younger population with less generous benefits will have ACG® concurrent risk scores that make it look sicker than it is relative to an older population with more generous benefits.
The Nextera cohort is younger; it looks sicker than its years on ACG® concurrent risk scores; its benefit package requires significantly more cost-sharing; and Nextera cohort members present less frequently for care than non-Nextera members with the same conditions . The Nextera cohort lands squarely atop a benefit design artifact.
On this basis alone, KPI Ninja’s measured risk difference will be too low, even without adverse selection into the non-Nextera cohort.
KPI Ninja’s risk measurements rest on undisclosed and unvalidated methods that were admittedly purpose-built by KPI Ninja to increase the risk scores of direct primary care populations. Anyone see a red flag?
As previously noted, KPI Ninja’s assertion that the risk difference between the cohorts is a mere 7.5%, and “not significant”, is extremely doubtful.
It literally required fabrication to get there.
ACG® risk adjustment, in the absence of pharma data, is fueled by standard diagnostic codes usually harvested from standard insurance claims data. But direct primary care physicians do not file insurance claims, and a great many of them actively resist entering the standard diagnostic codes used by ACG® into patient EHRs. Indeed, direct primary care doctors typically do not use the same EHR systems used by nearly all other primary care physicians. KPI Ninja has referred to a “data donut hole” of missing standard diagnostic codes which it sees as unfairly depriving direct primary care practitioners of the ability to defend themselves against charges of cherry-picking.
Milliman Actuaries are a world leader in health care analysis. The Society of Actuaries grant-funded a team from Milliman for a comprehensive study of direct primary care. That highly-qualified team ended up relying on risk measurements based on age, gender, and pharmaceutical usage in part because, after carefully addressing the data donut hole problem, they could find no satisfactory solution to it.
But KPI Ninja implicitly claims to have found the solution that eluded the Milliman team; they just do not care to tell us how it works. The cure apparently involves using “Nextera Zero Dollar Claims (EHR)” to supply the diagnostic data input to ACG® software. Nextera does not explain what “Nextera Zero Dollar Claims (EHR)” actually are. It might be — but there is no way to tell — that KPI Ninja’s technology scours EHR that typically lack diagnosis codes, even long after the EHR are written, to synthesize an equivalent to insurance claim diagnosis codes which can then be digested by ACG®.
Concerns about the reliability of such synthetic claims is precisely what lead the Milliman actuaries away from using a claims/diagnosis based methodology. KPI Ninja boldly goes exactly there, without telling us exactly how. Only a select few know the secret-sauce recipe that transformed direct primary care EHR records into data that is the equivalent of diagnosis code data harvested from the vastly different kind of diagnostic code records in claims from fee for service providers.
There is no evidence that KPI Ninja’s magical, mystery method for harvesting diagnosis code has been validated, or that KPI Ninja has the financial or analytical resources to perform a validation or, even, that KPI Ninja has ever employed or contracted a single certified actuary.
That KPI Ninja validate its methods would be of at least moderate importance, given KPI Ninja’s general business model of providing paid services to the direct primary community. But validation becomes of towering significance for risk-related data precisely because KPI Ninja’s methodology for risk data was developed for the clearly expressed purpose of helping direct primary care clinics address charges of cherry-picking by developing data specific to justifying increases in direct primary care member risk scores.
Validation in this context means that KPI Ninja should demonstrate that its methodologies are fair and accurate. Given KPI Ninja’s stated goal of increasing direct primary care risk scores, the most obviously pressing concern is that the method increases population risk scores only in proportion to actual risk.
For example, the ACG® technical manual itself warns about risk scores being manipulated by the deliberate upcoding patient risk. Even though sometimes detectible through audits, this has happened fairly often under CMS’s risk-adjusted capitation plans.
There is no evidence that KPI Ninja’s secreted data development process, whatever it may have been, included any protection from deliberate larding of the EHR by direct primary care providers. Then, too, if the “Nextera Zero Dollar Claims (EHR)” process is to any degree automated, a single bad setting or line of program code might bake risk measurement upcoding into the cake, even if the baker/programmer had only the best of intentions.
**********
An outward manifestation of upcoding in a situation like Nextera’s would be a “perfect storm” as described above. In this regard, note that on page 7 of the study, KPI Ninja explains that its risk scoring was built from six categories of risk factors. The most sharply differing of the six, and the only one pointing to greater Nextera risk, was “hospital dominant morbidities”. These are the risk conditions that most reliably generate inpatient hospital admissions. KPI Ninja tells us that the Nextera population carried these conditions at a 37% greater rate than the other group.
Miraculously, despite KPI Ninja reporting this heightened inpatient hospitalization risk for the Nextera population on page 7, KPI Ninja reports on page 10 that Nextera reduced inpatient hospital admissions by 92.7%.It seems likely that something in Nextera’s secreted processing results in inclusion of an unusually large number of erroneous hospital dominant morbidities codes from Nextera’s EHR records.
**********
* Note, too, that even if Nextera had kept the exact same complete EHR records as a standard FFS practice, complete with ICD-10 codes, the fact that such records need never be submitted for third-party audit — as they would for most other entities keeping such records for the purpose of risk measurement — would leave risk measurement subject to self-interested larding. (Favorable self-reports do not become less fraught after being laundered through expensive Johns Hopkins ACG® software.)
More importantly, on a broader level, developing and executing an EHR-to-claims code conversion process required that someone at KPI Ninja create and interpret uniform, objective, and precise standards for doing so. What were the standards? How were they created? Who applies them? What steps were taken to validate the process?
There are only two things we know for certain about the EHR-to-diagnostic claims process: first, that KPI Ninja essentially promised to deliver increased DPC cohort risk scores to Nextera; and, second, that Nextera paid KPI Ninja for its efforts.
No matter how good ACG® software may be in turning accurate diagnostic codes into accurate risk predictions, the risk measurements cranked out for Nextera patients can be no more valid than the diagnostic data generated by KPI Ninja’s secrets.
Because there is no real transparency on KPI Ninja’s part as to how it generates, from Nextera EHRs, the data needed for AGC® risk adjustment, and no evidence that such a methodology has been validated, it is impossible to confirm that KPI Ninja risk measurement of the Nextera cohort has ANY meaningful connection to reality.
Proper risk adjustment by itself would likely erase nearly all of Nextera’s $913 savings claim.
As mentioned above, looking solely at the age and gender distribution of the Nextera and non-Nextera cohorts and applying Dale Yamato’s landmark data set suggests that the costs of the non-Nextera cohort would run 17% higher than the Nextera cohort. But doing risk adjustment on that basis alone is equivalent to assuming that cohort membership is a serendipitous result. In reality, members select themselves into different cohorts based on their self-projections of needs for services.
SVVSD employees and their families did not pick plans based on age and gender. They pick the plan that will best meet their medical needs. Many of those with greater medical needs for expensive downstream care will realize that the non-Nextera plan is less generous to them and reject Nextera membership. When this adverse selection drives plan selection, an increase in, say, the average age of the cohort population is an indirect effect, a trailing indicator of the driving risk differential. Accordingly, the 17% figure derived from the Yamamoto data should be treated as a floor for risk adjustment.
Even a risk-adjustment of 17% — with no other adjustments — would lop off over half of Nextera’s $913 savings claim. If the true risk difference is reflected by the 43% difference between cohort claims histories reported previously in Nextera’s last published study (different employer, same clinic), Nextera may be the costliest move that school district ever made.
Even without taking population health risk into account, I show in other posts — especially here and here — that the KPI Ninja Nextera study still falls far short of demonstrating its $913 claims.
Summary
The Nextera “study” by KPI Ninja misappropriated the prestige of a Johns Hopkins research team to support its risk measurement claims; relied on an undisclosed and unvalidated methodology for obtaining population risk measurements; obtained highly dubious risk measurement results; and sharply mischaracterized the significance of those results. In the end, because applying even their own risk measurement results would have reflected negatively on Nextera, they never actually performed risk adjustment of the cost and utilization data under study.
Three major adjustments are needed, even without correcting the IP admit rate problem or arriving at a more reasonable risk adjustment.
Comparing data from Nextera patients and non-Nextera patients in the SVVSD programs requires three major adjustments which KPI Ninja never attempted. Computations here.
Because of the different benefit structures, the district’s claim costs for Nextera members reflect a large measure of savings, not due to Nextera, but due to the fact that the district pays less for the exact same claims from Nextera members than for “Choice” plan member warranting an downward adjustment of the district’s total costs for Choice members by a factor of 0.905.
The much richer overall benefit structure for non-Nextera also induces utilization, warranting a second downward adjustment of Choice total costs (by a factor of 0.950%
Applying all three adjustments reduces the claimed $913 savings to $255, bring the percentage savings down from 27% to less than 8%. Even that value assumes that the Nextera report was correct in its astonishing finding that the non-Nextera population of teachers and children had a IP admission rate of 246 per thousand.
The weight of external evidence suggests that supplying missing pharmacy data will not rescue any significant part of Nextera’s claim.
After acknowledging the complete absence of pharmacy cost data, KPI Ninja dismissed concern about the omission by repeatedly suggesting that inclusion could only showcase additional savings for Nextera members. The only support KPI Ninja offered for that suggestion was KPI Ninja’s trust-me account of its own, unidentified, and unpublished “research” performed in the course of paid service to the direct primary care industry.
The opposite conclusion — that pharmacy data might well reveal additional direct primary care costs — is supported by actual evidence. The only independent and well-controlled study of a direct primary care clinic, the landmark Milliman’s landmark study, found that after risk adjustment, the direct primary care cohort members had a slightly higher pharma usage than their counterparts. And a non-independent study that relied on only on propensity matched controls plainly suggests that one successful DPC strategy is to reduce high expense downstream costs through increasing medication compliance; the Iora clinic involved saw a 40% increase in pharmacy refills alongside significant reductions in various levels of hospital utilization.
Nextera’s claim to reduce the employer’s cost of chronic conditions suffers from some of the same problems as Nextera’s broadest claims — plus an even bigger one.
The report’s largest table, found on page 12, ostensibly shows various employer costs differences between Nextera patients and Choice patients associated to a selection of sixteen chronic conditions. For 10 of 16 Nextera claims employer cost reductions while, for the remaining six, Nextera confesses increased employer costs. Here is a
selected, condensed line from that table with two added amending lines. The first line of amendments applies the previously discussed adjustments to the employer’s cost for induced utilization (0.950).[1] This adjustment cuts the supposed savings by $62, a mere warmup act.
[1] We omit cohort wide risk adjustment in this table to avoid the risk of over-correction, knowing that people on the same chronic conditions line have already been partially sorted on the basis of shared diagnostics. We omit the plan benefit adjustment so, in our second line of amendment, we can introduce the cost of primary care for the chronic conditions of Nextera members without fear of duplicating the portion of the primary care cost intrinsic to our global adjustment (0.905) for benefit package design.
The second amending line is added to remove additional skew that arises because for Choice members, employer claim costs may flow from both primary care payments and downstream care payments, while for Nextera members employer claim costs come only from downstream care.
Nextera members do receive primary care — some of the most expensive primary care in the world, in fact. Nextera’s subscription fees average $839 PMPY. Fair comparison of employer costs for chronic conditions requires an accounting of Nextera’s fees as part of the employer costs for chronic conditions. Including Nextera’s fees turns the chronic conditions table significantly against Nextera’s claims. Nextera has not demonstrated its ability to lower the costs of chronic disease.
The same issue infects the Nextera report’s computation of savings on E & M visits, on page 10.
The study omitted important information about how outlier claimants were addressed.
While KPI Ninja did address the problem of outlier claimants, it is frustrating to see about 40% of total spend hacked away from consideration without being told either the chosen threshold for claims outlier exclusion or the reasoning behind the particular choice made.
KPI Ninja makes clear that it excluded outlier claims amounts from the total spend of each cohort. But it is also salient whether members incurring high costs were excluded from the cohort in compiling population utilization rates or risk scores.
The analyst understood that a million-dollar member would heavily skew cost comparison. If, however, the same million-dollar member had daily infusion therapy, this could heavily skew KPI Ninja’s OP visit utilization comparison. And, if that same member and a few others had conditions with profoundly high risk coefficients that might have a significant effect on final risk scores.
The better procedure is to avoid all skew from outliers. The Milliman report excluded members with outlier claims from the cohort for all determinations, whether of cost, utilization or, even, risk. In their report, KPI Ninja addressed outlier members only in terms of their claims cost. There is no indication that KPI Ninja appropriately accounted for outlier patients in its determination of utilization rates or population risk.
A significant aspect of risk measurement may have been clarified by accounting properly for outlier. And a good chunk of that astonishing IP admit figure for Choice patients might have vanished had they done so.
A study design error by KPI Ninja further skews cost data in Nextera’s favor by a hard to estimate amount.
“The actuary should consider the effect enrollment practices (for example, the ability of participants to drop in and out of a health plan) have had on health care costs.”
But the actuarial wannabees at KPI Ninja did not do that. The only claims cost data marshaled for this study were claims for which the district made a payment. Necessarily, these were claims for which a deductible was met. Because KPI Ninja did not follow the guidance from the actuarial board, however, it ended up with two significantly different cohorts in terms of the cohort members’ ability to meet the district’s $2000 annual deductible and maximum out of pocket expense limit.
Specifically, the average time in cohort for a non-Nextera member was 11.1 months; for Nextera it was only 10.1.[2] On average, Nextera members had twice as many shortened deductible years as non-Nextera members. And shortened deductible years mean more unmet deductibles and mOOPs, and fewer employer paid claims; in insurance lingo, this is considered less “exposure”. The upshot is that the reported employer paid claims for the two cohorts are biased in Nextera’s favor.
[2] Most of the difference is related to KPI Ninja’s choosing a school year for data collection when plan membership and the deductible clock runs on a calender year. Nextera has publicly bragged of seeing a boost in membership for its second plan year. Those new members had spent only eight months of plan membership when the study period ended.
To largely eliminate this distortion, KPI Ninja need only have restricted the study to members of either cohort who had experienced a complete deductible cycle. To estimate the amount of distortion after the fact is challenging, and the resulting adjustment may be too small to warrant the effort. What would make more sense would be for Nextera to just send the data where it belonged in the first place, to a real actuary who knows how to design an unbiased study.
A related error may have infected all of KPI Ninja’s utilization calculations, with potentially large consequences. KPI Ninja’s utilization reduction claims on page 10 appear not to have been normalized to correct for the difference in shortened years between the two cohorts. If they have indeed not been so adjusted, then all the service utilization numbers shown for Nextera members on that page currently need an upward adjustment of 10%. One devastating effect: this adjustment would completely erase Nextera’s claim of reducing utilization of emergency departments.
There is no evidence that the utilization data were normalized to correct for the one-month shortfall of Nextera members “in cohort dwell time”.
Summary of all current Nextera posts.
The two astonishing claims of Nextera’s school district advertising blitz are deeply misleading and unsupported. In no meaningful sense, does Nextera save 27% or $913 per year for every patient served by Nextera’s doctors rather than by the Saint Vrain Valley region’s traditional, fee-for-service primary care physicians. In no meaningful sense, do patients served by Nextera doctors have 92.7% fewer inpatient hospital admissions than those served by the Saint Vrain Valley region’s traditional, fee-for-service primary care physicians.
The KPI Ninja report on Nextera is at war with the best available evidence on direct primary care, that from the Milliman study. The KPI Ninja analysis head-faked risk adjustment, an essential feature of plan comparison, but actually performed none at all. The vast bulk of the reported cost savings turn on the dubious finding that a low risk population had a Medicare-like hospital admissions rate they could have reduced by choosing Nextera’s physicians.
An adequate study required not only risk adjustment, but also adjustments for induced utilization and for normalizing employer share cost based on the benefit plans. Combined all adjustments cut the purported Nextera savings down from $913 to $255, even accepting as given a freakishly high IP admission rate and a freakishly low risk adjustment of 7.5%.
Every single one of the report’s claims that Nextera lowered the cost of various downstream care services is tainted by one or more of these unaddressed factors.
Credibility requires a well-designed study and careful analysis, transparency, candor, and a firm understanding of the many effects of benefit design. The KPI Ninja report on Nextera had none of it. It is, at best, a spin doctor’s badly concocted puff piece.Promotion of KPI Ninja’s work on behalf of one hundred Nextera physicians — by video, by press release,and by distribution of the report by social media and otherwise — is false advertising that demands correction.
One pet theme of most D-PCPs is, “Who can better determine quality better than my patient?”, a question invariably coupled to its speaker’s brag about a high patient retention rate.
And yet, in the Union County employee DPC clinic study, the actuaries observed a huge risk selection bias against the DPC, enough to require a 8.3% risk adjustment. Yet, the actuarial values of the competing DPC and FFS were very close to each other. So if cost did not drive the adverse selection made, what did?
A commonly given explanation is that older, sicker patients preferred sticking with their established PCP rather than being forced to choose between a small number of doctors working for the DPC clinic.
But does this not evidence that access to a larger community of fee for service doctors produced quality care? After all, who can better determine quality than those chronically ill patients who turned down DPC clinics?
DPC redux.
Why would anyone expect that spreading the annual compensation of a primary care physician over one-third as many patient panel members would result in cost savings?
Why would anyone expect that finding a physician to give quality care that matches her needs among no more than two thousand direct primary care physicians would be more likely than finding quality care that matches her needs among the one hundred and fifty thousand who accept insurance?