CHANGED GRADE: The mixed bag of Milliman earns a final grade: C+

Skillful actuarial work on risk adjustment. A clear warning against relying on studies that ignored risk adjustment. Clear repudiation of a decade of unfounded brags.
An admirable idea on “isolating the impact of DPC model” from the specific decisions of a studied employer.
Milliman should have recognized that the health service resources that go into providing direct primary are vastly more than the $8 PMPM that emerged from its modeling and should have done more to subject the data on which the number rested to some kind of validation.
Upshot: there is still no solid evidence that direct primary care results in a reduced overall level of utilization of health care services. Milliman’s reporting needs to clearly reflect that.

Overview: A core truth, and a consequence.

The Milliman report on the direct primary care option in Union County has significant truth, an interesting but unperfected idea, and staggering error. The core truth lay in Milliman determining through standard actuarial risk adjustment that huge selection effects, rather than the wonders of direct primary care, accounted for a 8.3% difference in total health care costs between DPC and FFS populations. Both Union County and the DPC provider known as Paladina Health had publicly and loudly touted cost differences of up to 28% overall as proof that DPC can save employers money. But naysayers, including me, were proven fully correct about Union County — and about a raft of other DPC boasts that lacked risk adjustment, like those regarding Qliance.1

The estimated selection pattern in our case study emphasizes the need for any analysis of cost and utilization outcomes for DPC programs to account for the health status and demographics of the DPC population relative to a control group or benchmark population. Without appropriate consideration for how differences in underlying health status affect observed claim costs and utilization patterns, analyses could attribute certain outcomes to DPC inappropriately. We urge readers to use caution when reviewing analyses of DPC outcomes that do not explicitly account for differences in population demographics and health status and do not make use of appropriate methodologies

Page 46 of Milliman/Union County study

Still, Union County had made some choices in regard to cost sharing that made some results seem less favorable for DPC than they needed to be. That’s where Milliman’s ingenuity came into play in what might be seen as an attempt to turn the County’s lemon into lemonade for the direct primary care industry. And that is where Milliman failed in two a major ways more than important enough to make the lemonade deeply unpalatable.


The Union County DPC program was even more of a lemon than Milliman reported.

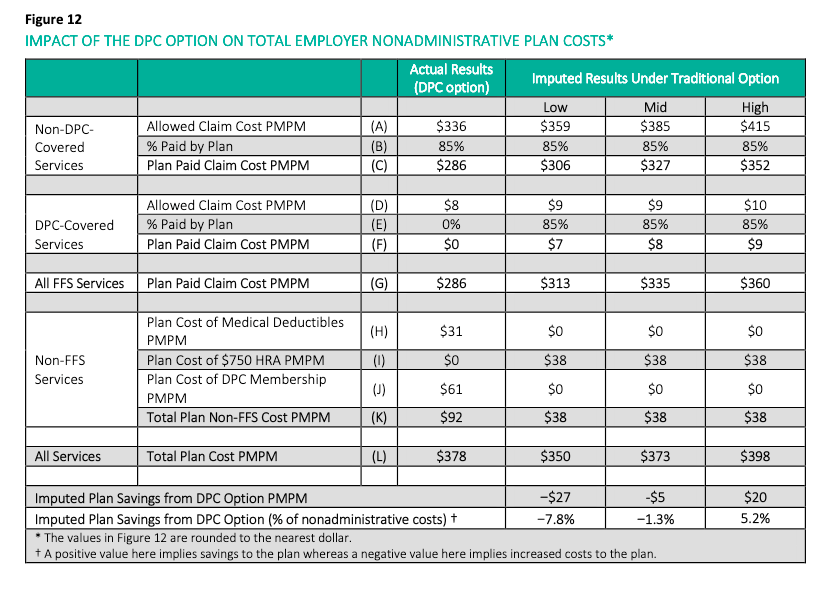
To the Milliman team’s credit, they did manage to reach and announce the inescapable conclusion that Union County had increased its overall health care expenditure by implementing the direct primary care option. Even then, however, Milliman vastly understated the actual loss. That’s because its employer ROI calculation rested on an estimate of $61 as the average monthly direct primary care fee paid by Union County to Paladina Health; the actual average month fee paid was $106. There had been no need for a monthly fee estimate as the actual fees were a matter of public record.

Though $1.25 million in annual savings had been claimed, the total annual loss by Union County was over $400,000. Though 28% savings had once been bragged, the County’s actual ROI was about negative 10%. Milliman’s reliance on an estimate of the fees received from the County, rather than the actual fees collected, made a fiscal disaster appear to be close to a break even proposition.

Milliman’s choice likely spared the county’s executive from some embarrassment.

For more detail on Union County’s negative ROI and Milliman’s understatements of it, click here and/or here.


The Milliman team came up with an interesting idea, but their thinking was incomplete and they flubbed the execution.

To prevent the County’s specific choices about cost-sharing from biasing impressions of the DPC model, Milliman developed a second approach that entailed looking only at a claim cost comparison between the two groups. According to Milliman, “this cost comparison attempts to isolate the impact of the DPC delivery model on the overall level of demand for health care services“. [Italics in original].


The Milliman calculation of 12.6% overall savings turns on a a massive underestimate of the cost of the direct primary clinic studied.

Milliman needed to determine utilization for the DPC clinic.

Milliman’s model for relative utilization is simple:

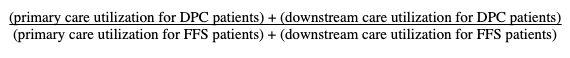
Milliman used claim costs for both downstream components of the computation, and for the FFS primary care utilization. But because DPC is paid for by a subscription fee, primary care utilization for the DPC patients cannot be determined from actual claims costs.

One reasonable way of estimating the health services used by DPC patients might be to use the market price of DPC subscriptions, about $61 PMPM. With this market value, the computation would have yielded a net utilization increase (i.e., increased costs) for DPC. Milliman eschewed that method.

Another reasonable way of estimating the health services used by DPC might be to estimate the costs of staffing and running a DPC clinic. Using readily available data about PCP salaries and primary care office overhead, estimated conservatively this would come to at least $40 PMPM. Had it sued that figure, Milliman would have been obliged to cut its estimate of savings by more than half.

The lower the value used for utilization of direct primary care services, the more favorable DPC appears. Ignoring models that would have pointed to $61 and $40 values, Milliman used a methodology that produced an $ 8 PMPM as the value of the resources required to provide direct primary care. This resulted in a computed 12.6% reduction in overall usage.

But $8 PMPM is an absurdly low value. Just try asking a few DPC providers what they would give you for eight dollars a month. Most will – rightly – regard it as an insult. Their usual charge for adult care is usually about 8 to 10 fold higher than that.

Milliman’s “ghost claims” method was ill-suited for DPC and vulnerable.

Milliman’s “solution”, however, turned on the stunning assumption that utilization of subscription-based holistic, integrative direct primary care could be accurately modeled using the same billing and coding technology used in fee for service medicine.

As a group, the DPC community loudly disparages such coding for failing to compensate most of the things they do to improve overall care, such as slack scheduling to permit long, same day visits. For another example, in the time frame studied by Milliman, there was no code for billing non-facing patient care coordination.

Examination of billing codes for downstream services is fully capable of harvesting the contributions the DPC plan may have made to reducing the health care resources used for downstream care. But owing to the lack of billing codes for the access and service level enhancements that characterize DPC, a billing code based model was largely incapable of capturing a significant share of the increased health care resources expended in delivering direct primary care.

Consider also that, D-PCPs consider coding for billing a waste of time and do not ordinarily use use billing friendly EHRs.

Yet Milliman chose to rely on the clinic’s unwilling DPC physicians to have accurately coded all services delivered to patients, then used those codes to prepare “ghost claims” resembling those used for FFS payment adjudication, and then to have submitted the ghost claims to the employer’s TPA, not to prompt payment, but solely for reporting purposes. The collected ghost claims were turned into the direct primary care services utilization by application of the Union County FFS fee schedule. The result was $8 PMPM.

The $8 PMPM level of clinic utilization determined by the ghost claims was absurd.

Valuing the health services utilization for patients at the direct primary care clinic at a mere $8 PMPM is at war with a host of things that Milliman knew or should have known about the particular clinic it studied, knew or should have known about the costs of primary care, and knew or should have known about the nature of direct primary care. Clinic patients were reportedly receiving three visits a year; this requires more than $8PMPM ($96 PMPY). The length of clinic visits was stressed. County and clinic brag 24/7 access and same day appointments for 1000 clinic patients. The clinic was staffed at one PCP to 500 members; at $96 a year, clinic revenue would have been $48,000 per PCP. This does not pass the sniff test.

The most visible path to Milliman’s $8 PMPM figure for health services demand for the delivery of direct primary care is that the direct primary care physicians ghost claims were consistently underreported. About what one might expect from “ghost claims” prepared by code-hating D-PCPs with no motivation to accurately code or claim (or, perhaps, even with an opposite motivation). Milliman even knew that the coding habits of the DPC practitioners were inconsistent, in that the ghost claims sometimes contained diagnosis codes and sometimes did not. Report at page 56.

Yet, Milliman did nothing to validate the “ghost claims”.

Because the $8 PMPM is far too low, the 12.6% overall reduction figure is far too high. As noted above, substituting even a conservative estimate of the costs of putting a PCP into the field slashes 12.6% to something like 4%. If in place of the $8 PMPM , the $61 market price determined in the survey portion of the Milliman study is used, Milliman’s model would show that direct primary care increases the overall utilization of health services.

For more detail on the “ghost claims” and erroneous primary care data fed to Milliman’s isolation model, click here.


Union County paid $95 a month to have Paladina meet an average member’s demand for primary health care services. That Milliman computed the health care services demanded in providing DPC to be $8 per month is absurd.


Milliman should amend this study by adapting a credible method for estimating the level of health services utilized in delivering primary care at the DPC clinic.

Milliman’s good work on risk adjustment still warrants applause. Indeed, precisely because the risk adjustment piece was so important, the faulty work on utilization should be corrected, lest bad work tar good, and good work lend credibilty to bad work.


1 The reaction to Milliman’s making clear the necessity of risk adjustment by those who had long promoted the Qliance boasts was swift and predictable: DPC advocates never ignore what can be lied about and spun. DPC Coalition is a lobbying organization co-founded by Qliance; a co-founder of Qliance is currently president of DPC Coalition. DPC Coalition promptly held a legislative strategy briefing on the Milliman study at which the Executive Director ended the meeting by declaring that the Milliman study had validated the Qliance data.

Did Ratner Industries uncover the secret of health care cost reductions?

To kick off our open enrollment period two years ago, we at Ratner Industries held a company wide employee meeting. There we dusted off our brand new offering of a high deductible plan option. To get a rough idea how many employees planned on electing each option we offered free bags of M&Ms to employees as they left, requesting that those leaning toward the high deductible option each take a bag of peanut M&Ms, while those remaining in our standard plan were asked to take only traditional M&Ms. About equal numbers took bags of each of the two kinds of M&Ms.

We just ran some claims data (fully risk adjusted, of course) for the first full year under these plan choices. We found that those who received peanut M&Ms had 12% lower utilization of services overall compared to those receiving traditional M&Ms.

Have we have proven the power of peanuts? Caiaphas, a commenter, has suggested that this a case of borrowed valor, with the HDHP plan having done the hard work for which the pro-peanut caucus has “improperly” taken credit. Caiaphas’s anti-peanut bias is evident.

Attn: AEG/WP. Milliman study implies 12.6% downstream care cost reductions for DPC.

The AEG/WP plan still isn’t likely to work. A $95 PMPM fee, increasing at the same rate as other medical expenses, and coupled to a 12.6% reduction down stream would evaporate all of AEG/WP’s claimed billion savings.

Healthcare Innovations in Georgia:Two Recommendations”, the report prepared by the Anderson Economic Group and Wilson Partners (AEG/WP) for the Georgia Public Policy Foundation, made some valuable contributions to deliberations about direct primary care. The AEG/WP team clearly explained their computations and made clear the assumptions underlying their report.

This facilitated public discussion that the Georgia Public Policy Foundation sought to foster in publishing the report. I have examined those assumptions in many prior posts. A large number of them addressed a focal assumption in the AEG/WP report’s calculations: that DPC participation could reduce the claims cost for downstream care by 15%, a number represented by AEG/WP as a low end estimate. The sole support offered in the AEG/WP report for this 15% presumption is a statement that, “the factor is based on research and case studies prepared by Wilson Partners.”

In addressing the 15% claim, I looked over all available evidence then available in support of the 15% claim. I found a lot of corporate brags, and some propaganda from partisans with their own smash-public-spending agenda, but nothing n the way of independent, actuarial sound evidence derived from risk-adjusted data from DPC clinics.

That has changed with a study by actuaries from Milliman in a May 2020 report to the Society of Actuaries concerning a thinly disguised employer (Union County, NC). Although I take issue with some of the lessons others have drawn from that report, the report implies that deploying the direct primary care model can reduce downstream care cost by 12.6%. [Maybe even 13.2%.]

Some cautions.

  • Milliman’s is only one study, and so far one of a kind.
  • The Milliman study confirms nearly all of what I have said about how deeply flawed all the prior studies were, largely because they did not look at issues around risk adjustment.
  • In light of the Milliman indicating reductions of 12.6%, the AEG/WP suggestion that 15% figure represents a low end estimated should be rejected.
  • For downstream care cost reductions, replacing AEG/WP 15% with Milliman’s 12.6% takes away 1/6th of AEG/WP claimed savings.
  • My other two major criticisms of the AEG/WP report still stand, and one of them is actually reinforced
    • AEG/WP’s assumption that effective DPC can be purchased for $70 per month even more clearly lowballs the likely cost
      • the clinic Milliman studied was paid $95 per member
      • a $95 per member fee would reduce AEP/WP claimed savings in the individual market by nearly half, and would result in no net savings in the employer markets. See calculator here.
    • AEG/WPs assumption that a $70 fee for direct primary care will remain flat for a decade is still incorrect.
  • A $95 PMPM fee, increasing at the same rate as other medical expenses, and coupled to a 12.6% reduction down stream will evaporate all of AEG/WP’s claimed billion savings.
  • The final point.
    • There is good reason to suspect that a direct primary care clinic receiving resources of $95 PMPM will outperform a direct primary care clinic receiving resources of $70 PMPM.
      • Milliman studied a clinic had that invested $95 PMPM in direct primary care and attained a presumed 12.6% downstream cost reduction; the increase in the spend for primary care exceeded the downstream savings; the employer had a net loss for using direct primary care.
      • a $70 direct primary care clinic will need a larger patient panel than its $95 competitor; its PCPs will have less time with patients and less availability; it will be less able to deliver same day appointments; so there is strong reason to expect that AEG/WP’s proposed $70 DPC will fall well short of the 12.6% downstream cost reduction level.

ATTN: Milliman. Even if Union County had not waived the $750 deductible, the County still would have lost money on DPC.

The lead actuary on Milliman’s study of direct primary care has suggested that the employer (Union County, NC, thinly disguised) would have had a positive ROI on its DPC plan if it had not waived the deductible for DPC members. It ain’t so.

Here’s the Milliman figure presumed to support that point.

https://www.soa.org/globalassets/assets/files/resources/research-report/2020/direct-primary-care-eval-model.pdf

It is true that removing the $31 figure of Line H, would lead to a tabulated result of total plan cost of $347, which would suggest net savings.

The problem is that the $61 figure of Line J of the Milliman report has been too low all along — and by more than $31.

Milliman got the $61 by estimating the plan cost of DPC membership, rather than learning what the actual plan cost was. $61 was the result of Milliman applying a 60:40 adult child split to fee levels drawn from Milliman’s survey of $75 adult and $40 child. But the publicly recorded contract between the DPC provider, Paladina, and Union County set the fees at $125 adult and $50 child, and $95 is the correct composite that should have been in Line J, representing $34 PMPM missed by Milliman.

Accordingly, even if the $31 cost that fell on the County for waiving the deductible is expunged from the calculation, the total plan costs for DPC would work out to $381 and would still exceed the total plan costs for FFS. The County’s ROI was indeed negative.

I can not tell you why Milliman used estimated fees of $61 rather than actual fees of $95. But doing so certainly made direct primary care look like a better deal than it is.

Risk adjustment, and more, badly needed for KPI Ninja’s Strada-brag

Amended 6/26/20 3:15AM

The Milliman report’s insistence on the importance of risk adjustment will no doubt see the DPC movement pouring a lot of their old wine into new bottles, and perhaps even the creation of new wine. In the meantime, the old gang has been demanding attention to some of the old wine still in the old bottle, specifically, the alleged 68% cost care reductions attributed to Strada Healthcare in its work with a plumbing company of just over 100 persons in Nebraska.

Challenge accepted.

KPI Ninja’s study of Strada’s direct primary care option with Burton Plumbing illustrates why so much of the old DPC wine turns to vinegar in the sunlight.

Strada-Burton-1-yr-Whitepaper

At an extreme, there will be those who anticipate hitting the plan’s mOOP in the coming year — perhaps because of a planned surgery or a long-standing record of having “mOOPed” year-in and year-out due to an expensive chronic condition; these employees will be indifferent to whether they reach the mOOP by deductible or other cost-sharing; for them, moreover, the $32 PMPM in fixed costs needed for DPC option is pure disincentive. Furthermore, any sicker cohort is more likely to have ongoing relationships with non-Strada PCPs with whom they wish to stay.

An average non-Strada patient is apparently having claims costs of $8000. With a $2000 deductible and say 20% coinsurance applied to the rest that’s an employee OOP of $3200 and a total employee cost of about $6100; with a $3000 deductible that’s an OOP of $4000 and a total cost of $7250 . Those who expect claims experience of $8000 are unlikely to have picked the DPC/$3K plan. Why $1100 pay more and have fewer PCPs from which to choose?

But what about an employee who anticipated claims only a quarter that size, $2000. With the $2000 deductible that would come to an OOP of $2000 and a total cost of $4860. With the $3000 deductible that would come to an OOP of $2000 and a total cost of $5250. For these healthier employees, the difference between plans is now less than a $400 difference. Why not pay $400 more if, for some reason, you hit it off with the D-PCP when Strada made its enrollment pitch?

The sicker a Burton employee was, the harder this paired-plan structure worked to push her away. It’s a fine cherry-picking machine.


Strada’s analyst, KPI Ninja, recently acknowledged Milliman’s May 2020 report as a breakthrough in the application of risk adjustment to DPC. In doing that, KPI Ninja tacitly confessed their own failure to work out how to reflect risk in assessing DPC for its string of older reports.

To date, as far as I can tell, not one of KPI Ninja’s published case studies has used risk-adjusted data. If risk adjustment was something that Milliman invented barely yesterday, it might be understandable how KPI Ninja’s “data-analytics” team had never used it. But risk adjustment has been around for decades. It’s significantly older than Direct Primary Care.

KPI Ninja should take this opportunity to revisit its Strada-Burton study, and apply risk adjustment to the results. Same for its Palmetto study and for its recently publicized, but risk-adjustment-free study, for DirectAccessMD. Or this one about Nextera.


Notice that, precisely because they have a higher deductible plan than their FFS counterparts, the Strada-Burton DPC patients faced greater cost-sharing discipline when seeking downstream care. How much of the savings claim in the Strada report owes to the direct primary care model, and how much to the a plan design that forced greater shopping incentives of DPC members?

It’s devilishly clever to start by picking the low-risk cherries and then use the leveraged benefit structure to make the picked cherries generate downstream cost savings.

The conjoined delivery of Strada DPC and enhanced HDHP makes the enhanced HDHP a “confounder” which, unless resolved, makes it virtually certain that even a risk adjusted estimate of DPC effectiveness will still be overly favorable to Strada DPC itself on utilization.


I have no doubt that risk adjustment and resolution of the confounding variable will shred Strada’s cost reduction claims. But, of course, if Strada is confident that it saved Burton money, they can bring KPI Ninja back for re-examination. It should be fun watching KPI Ninja learn on the job.

I’m not sure it would be fair for KPI Ninja to ask Strada to pay for this work, however. KPI Ninja’s website makes plain that its basic offering is data analytics that make DPC clinics look good. Strada may not like the result of a data analytic approach that replaces its current, attractive “data-patina” with mere accuracy.


I’ll skip explaining why the tiny sample size of the Strada-Burton study makes it of doubtful validity. Strada will see to that itself, with vigor, the moment it hears an employer request an actuarially sound version of its Burton study.


Special bonus segment. Burton had a bit over 100 employees in the study year, and a large fraction were not even in the DPC. I’m stumped that Burton had a one-year hospital admission rate of 2.09 per thousand. If Strada/Burton had a single hospital admission in the study year, Strada/Burton would had to have had 478 covered lives to reach a rate as low 2.09. See this spreadsheet. If even one of 200 covered lives had been admitted to the hospital, the inpatient hospitalization rate would have been 5.00.

The use of the 2.09 figure suggests that the hospital admission rate appearing in the whitepaper was simply reported by Strada to the KPI Ninja analyst. A good guess is that it was a hospitilization rate Strada determined for all of its patients. Often, DPC practices have a large number of uninsured patients. And uninsured patients have low hospitilization rates for a fairly obvious reason.

DPC is uniquely able to telemed: a meme that suffered an early death.

An update to this post.

Larry A Green Center / Primary Care Collaborative’s Covid-19 primary care survey, May 8-11, 2020:

In less than two months, clinicians have transformed primary care, the largest health care platform in the nation, with 85% now making significant use of virtual health through video-based and telephone-based care.

Larry A Green Center and Primary Car Collaborative.

These words spelled the end of the meme that direct primary care was uniquely able to telmed. “DPC-Telly”, as the meme was known to her close friends, was briefly survived by her near constant companion, “Covid-19 means FFS is failing financially, but DPC is fine”. Further details here.

The Nextera/DigitalGlobe study design made any conclusion on the downstream effect of subscription primary care impossible.

The study indiscriminately mixed subscription patients with pay-per-visit patients. Selection bias was self-evident; the study period was brief; and the study cohort tiny. Still, the study suggests that choosing Nextera and its doctors was associated with lower costs; but the study’s core defect prevents the drawing of any conclusions about subscription primary care.

ADDENDUM of January 2021: In effect, for the seven month duration of the study, the average enrollee in the Nextera option faced a deductible more than $600 higher than those who declined Nextera, further skewing results in Nextera’s favor. See new material near bottom of post.


The Nextera/DigitalGlobe “whitepaper” on Nextera Healthcare’s “direct primary care” arrangement for 205 members of a Colorado employer’s health plan is such a landmark that, in his most recent book, an acknowledged thought leader of the DPC community footnotes it twice on the same page, in two consecutive sentences, once as the work of a large DPC provider and a second time, for contrast, as the work of a small DPC provider.

The defining characteristic of direct primary care is that it entails a fixed periodic fee for primary care services, as opposed to fee for service or per visit charges. DPC practitioners, their leadership organizations, and their lobbyists have made a broad, aggressive effort to have that definition inscribed into law at the federal level and in every state .

So why then does the Nextera whitepaper rely on the downstream claims costs of a group of 205 Nextera members, many of whom Nextera allowed to pay a flat per visit rather than having compensation only through than a fixed monthly subscription fee?

This “concession” by Nextera preserved HSA tax advantages for those members. This worked tax-wise because creating a significant marginal cost for each visit in this way actually creates a form of non-subscription practice within the intended medical economic goals for which HDHP/HSA plans were created— in precisely the way that a subscription plan, which puts a zero marginal cost on each visit, cannot.

The core idea is that having more immediate “skin the game” prompts patients to become better shoppers for health care services, and lowers patient costs. Those who pay subscription fees and those who pay per visit fees obviously face very different incentive structures at the primary care level. It would certainly have been interesting to see whether Nextera members who paid under the two different models differed in their primary care utilization.

More importantly, however, precisely because the fee per visit cohort all had HDHP/HSAs, they had enhanced incentives to control their consumption of downstream costs compared to those placed in the subscription plan, who did not have HDHP/HSA accounts. The per-visit cohort can, therefore, reasonably be assumed to have expereinced greater downstream cost reduction per member than their subscription counterparts.

Had the whitepaper broken the plan participants into three groups — non-Nextera, Nextera-subscriber, Nextera per-visit — there is good reason to believe that the subscription model would have come out one of the two losers.

Instead, Nextera analyzed only two groups, with all Nextera members bunched together. And, precisely because the group mixed significant numbers of both fixed fee members and fee for service members, it is logically impossible to say from the given data whether the subscription-based Nextera members experienced downstream cost reduction that were greater than, the same as, or less than the per-visit-based Nextera members. So, while the study does suggest that Nextera clinics are associated with downstream care savings, it could not demonstrate that even a penny of the observed benefit was associated with the subscription direct primary care model.


Here are the core data from the Nextera report.

Nextera Healthcare + DigitalGlobe: A Case Study

205 members joined Nextera; they had prior claim costs PMPM of $283.11; the others had prior claim costs PMPM of $408.31. This a huge selection effect. The group that selected Nextera had pre-Nextera claims that were over 30% lower than those declining Nextera.

Rather than award itself credit for that evident selection bias, Nextera more reasoanbly relied on a form of “difference in differences” ( DiD) analysis. They credited themselves, instead, for Nextera patients having claims costs decline during seven months of Nextera enrollment by a larger percentage basis (25.4%) than claim cost for their non-Nextera peers (5.0%), which works out to a difference in differences (DiD) of 20.4%.

Again, the data from mixed subscription and per-visit member can only show the beneficial effect of choosing Nextera, rather than declining Nextera. The observed difference appears to be a nice feather in Nextera’s cap; but the data presented is necessarily silent on whether that feather can be associated with a subscription model of care.


It cannot be presumed that Nextera’s success could have been replicated on the DigitalGlobe employees who declined Nextera.

In the time since the report, Nextera has actively claimed that its DigitalGlobe experience demonstrates that it can reduce claim costs by 25%. Nextera should certainly amend that number to the reflect the smaller difference in differences that its report actually shows (20%). But even that substituted claim of 20% cost reduction would require significant qualification before extension to other populations.

Even before they were Nextera members, those who eventually enrolled seem to have had remarkably low claims costs. The Nextera population may be so much different from those who declined Nextera that the trend observed for the Nextera cohort population can not be assumed even for the non-Nextera cohort from DigitalGlobe, let alone for a large, unselected population like the entire insured population of Georgia.

Consider, for example, an important pair of clues from the Nextera report itself: first, Nextera noted that signups were lower than expected, in part because of many employees showed “hesitancy to move away from an existing physicians they were actively engaged with”; second, “[a] surprising number of participants did not have a primary care doctor at the time the DPC program was introduced”.

As further noted in the report, the latter group “began to receive the health-related care and attention they had avoided up until then.”

A glance at Medicare, reminds us that routine screening at the primary care level is uniquely cost-effective for beneficiaries who may previously avoided costly health care. Medicare’s failure to cover regular routine physical examinations is notorious. But there is one reasonably complete physical examination that Medicare does cover: the “Welcome to Medicare” exam.

First attention to a population of “primary care naives” is likely a way to pick the lowest hanging fruit available to primary care. Far more can be harvested from a population enriched with people receiving attention for a first time than from a group enriched with those previously engaged with a PCP.

Accordingly, the 20% difference in differences savings in the Nextera group cannot be automatically extended to the non-Nextera group.

Relatedly, the comparative pre-Nextera claim cost figure may reflect that the Nextera population had a disproportionately high percentage of children, of whom a large number will be “primary care naive” and similarly present a one-time only opportunity for significant returns to initial preventative measures. But a disproportionately high number of children in the Nextera group means a diminished number of children in the remainder — and two groups that could not be presumed to respond identically to Nextera’s particular brand of medicine.

A similar factor might have arisen from the unusual way in which Nextera recruited its enrollees. A group of DigitalGlobe employees with a prior relationship with some Nextera physicians first brought Nextera to DigitalGlobe’s attention and then apparently became part of the enrollee recruiting team. Because of their personalized relationship with particular co-workers and their families, the co-employee recruiters would have been able to identify good matches between the needs of specific potential enrollees and the capabilities of specific Nextera physicians. But this patient panel engineering would result in a population of non-Nextera enrollees that was inherently less amenable to “Nexterity”. Again, it simply cannot can be assumed that the improvement seen with the one group can simply be assumed for any other.

Perhaps most importantly, let us revisit the Nextera report’s own suggestion the difference in populations may have reflected “hesitancy to move away from an existing physician they were actively engaged with”. High claims seem somewhat likely to match active engagement rooted in friendship resulting from frequent proximity. But consider, then, that the frequent promixity itself is likely to be the result of “sticky” chronic diseases that have bound doctor and patient through years of careful management. It seems likely that the same people who stick with their doctors are more likely to have a significantly different and less tractible set of medical conditions than those who have jumped to DPC.

Absent probing data on whether types of different health conditions prevail in the Nextera and non-Nextera populations, it is difficult to draw any firm conclusion about what Nextera might have been able to accomplish with the non-Nextera population.

These kinds of possibilities should be accounted for in any attempt to use the Nextera results to predict downstream cost reductions outcomes for a general population.


Perhaps, the low pre-Nextera claims costs of the group that later elected Nextera reflects nothing more than the Nextera group having a high proportion of price-savvy HDHP/HSA members. If that is the case, Nextera can fairly take credit for making the savvy even savvier. But it cannot be presumed that Nextera could do as well working with a less savvy group or with those who do not have HDHPs.


Whether or not Nextera inadvertently recruited a study population that made Nextera look good, that study population was tiny.

Another basis for caution before taking Nextera’s 20% claim into any broader context is the limited amount of total experience reflected in the Nextera data — seven months experience for 205 Nextera patients. In fact, Nextera’s own report explains that before turning to Nextera, DigitalGlobe approached several larger direct primary care companies (almost certainly including Qliance and Paladina Health); these larger companies declined to participate in the proposed study, perhaps because it was too short and too small. The recent Milliman report was based ten fold greater claims experience – and even then it had too few hospitalizations for statistical significance.

Total claims for the short period of the Nextera experiment were barely over $300,000, the 20% difference in difference for claimed savings comes to about $60,000. That’s a pittance.

Consider that two or three members may have elected to eschew Nextera in May 2015 because, no matter how many primary care visits they might have been anticipating in the coming months, they knew they would hit their yearly out-of-pocket maximum and, therefore, not be any further out of pocket. Maybe one was planning a June maternity stay; another, a June scheduled knee replacement. A third, perhaps, was in hospital because of an automobile accident at the time for election. Did Nextera-abstention of these kinds of cases contribute importantly to pre-Nextera claims cost differentials?

The matter is raised here primarily to suggest the fragility of a purported post-Nextera savings of a mere $60,000 over seven months. An eighth month auto accident, hip replacement, or Cesarean birth could evaporate a huge share of such savings in a single day. The Nextera experience is too small to be reliable.


Nextera has yet to augment the study numbers or duration.

Nextera has not chosen to publish any comparably detailed study of downstream claims reduction experience more recent than 2015 data — whether for DigitalGlobe or or any other group of Nextera patients. That’s a long time.

Nextera now has over one-hundred doctors, a presence in eight different states, and patient numbers in the tens of thousands. Shouldn’t there be newer, more complete, and more revealing data? (Note added in 2021 – In October 2020, Nextera provided new admittedly incomplete data, involving many more members and of longer duration. It was very, very revealing. See this analysis.)


Summation

Because of its short duration and limited number of participants, because it has not been carried forward in time, because of the sharp and unexplained pre-Nextera claims rate differences between the Nextera group and the non-Nextera group, and because its reported cost reduction do not distinguish between subscription members and per-visit members, the Nextera study cannot be relied on as giving a reasonable account of the overall effectiveness of subscription direct primary care in reducing overall care costs.


January 2021 Addendum: An additional study design defect skews results in Nextera’s favor.

June 1 is an odd time to start a health expenditure study, coming as it does near the mid-point of an annual deductible cycle. In the five months prior to the opportunity to enroll in Nextera, those who declined Nextera had combined claims that averaged $2041, while those who opted for Nextera had combined claims of only $1420. The average employer plan in the US in 2015 had a deductible of $1318 for single employee. Whatever the level at Digital Globe, it is quite certain that the group that eschewed Nextera had significantly more members who had already met their 2015 deductible than those in the Nextera group, and more who were near to doing so.

Note that an employee who had already met her annual deductible at the time Nextera became available would have had deductible-free primary care for the rest of the year, whether she joined Nextera or not. She would have gained nothing by choosing Nextera, but may well have had to change her PCP to one of the few on Nextera’s ultra-narrow panel.

More importantly, however, it is well known that, in the aggregate, once patients have cleared their deductible for an annual insurance cycle, they increase their utilization for the rest of the cycle. On the other hand, patients who do not envision meeting their deductible tend to defer utilization. Ask any experienced claims manager what happens in November and December.

Higher relative claims going forward for the non-Nextera group would be entirely predictable even if the Nextera and non-Nextera populations had had precisely equal risk profiles and had received, in the seven-month study period, precisely the same package of primary care services.


Nextera’s case study also had errors of arithmetic, like this one:

The reduction rounds off to 5.0%, the number I used in the larger table above.

Iora’s Las Vegas experience is an inapt model for DPC, and shows no real cost reduction.

While DPC Coalition features an Iora Clinic in Las Vegas as a data model of the joys of direct primary care, it is simply not representative of a general population. That clinic focused on a very high need population, every member chronically ill. We are looking at people with $11,000 claim levels at 2014 prices; they are “superutilizers” in what is called a “hotspotters” program.

A close look at the very Iora data that the DPC Coalition presented to the United States Senate makes clear how inappropriate it is to use outlier populations.

https://www.finance.senate.gov/imo/media/doc/Direct%20Primary%20Care%20Coaltion%20-%20SFC%20Chronic%20Care%20Comments.pdf

The green bars at left were drawn from what Iora and the DPC Coalition regards as “well-matched controls with equivalently sick populations”. Like the blue bars, which represent the Iora study group, the green bars are clearly far higher than the red bars that represent the general local population (Las Vegas). Since the blue bars are also a bit higher than the green bars, however, the question arises: in what sense were these controls “well-matched controls with equivalently sick populations”. To be meaningful, I suggest, these controls would had to have been matched by some assessment of chronic conditions and risk scores.

But why, if the groups were closely matched, is the pre-treatment bar at $935 for the study group but only $806 for the control group. If the controls were indeed well matched then there must have been some sort of selection effect. I suggest that this was the result of patients being recruited into the Iora program when they presented with a high level of acute exacerbations of their underlying chronic conditions, with the “control group” fashioned retroactively based on those with the same chronic conditions – sans the level of exacerbations that had triggered recruiting.

A treatment year passed. A mix of medical inflation and noise bring the costs for the control group up to $861. But the total costs of the study group at the end of the treatment year, including the fees paid to Iora (shown in gold), are now $889 and still remain higher than the “well matched controls”.

And why have the total costs of the treatment group dropped by 5%? Because they’ve gotten “better” — regressing to the mean in their need for services. Indeed, if the controls had been well matched by risk scores at the start of the year, this is entirely predictable.

Is this wild speculation on my part? Hardly. A NEJM research piece noted regression to the mean of matched controls when a study of one of the pioneering superutilizer programs (Camden) showed no difference in hospitalization rates during the original study period between plan members and non-members. Sure, there might be some other explanation for the exact levels and changes seen in the bar graphs.

But what remains is this: During the treatment period, the total costs of the Iora study group, including the fees paid to Iora, were 3% more than the total costs of what Iora claimed were well matched controls.

If “well matched controls” means anything sensible, the Iora study does not demonstrate a net cost reduction.


Back in the 90s, I did some federal legislative advocacy on health policy. I once asked Representative Sander Levin (D -Michigan) to present an amendment that would swing about $15 Billion in the direction of low income citizens.

“I’d love to do that, Mr. Ratner. But you’ll have to show me a $15 Billion offset. If you can find it, get it to me this week.”

I actually found the money. The CBO had missed a $15 billion item in scoring the bill. You can bet I busted my ass (and confirmed my understanding with my betters like Stan Dorn) to make sure that I was not casually handing a load of careless bullshit to a federal legislator.

I guess times have changed.

Why is subscription DPC the precise hill on which self-styled “patient-centered” providers have chosen to make a stand?

A subscription model is not the most patient-centered way.

Consider this primary health care arrangement:

  • Provider operates a cash practice
    • no insurance taken
    • no third party billed
  • Provider may secure payment with a retainer
    • balance is carried
    • refreshed when balance falls below a set threshold
  • Provider may bill patient for services rendered on any basis other than subscription
    • specific fees for specific services; or
    • flat per visit fee for all patients; or
    • patient-specific flat visit fee, based on patient’s risk score; or
    • patient-specific flat visit fee, based on affinity discounts for Bulldog fans; or
    • fee tiers based on time/day of service peak/off-peak; or
    • fee tiers based on communication device: face-to-face/ phone/ video/ drum/ smoke signal; or
    • any transparent fee system based on transparent factors; but
  • Provider elects not to bill a subscription fee, e.g., she does not require regular periodic fees paid in consideration for an undetermined quantum of professional services.

The plan above is price transparent to both parties. It is more transparent than a subscription plan because it is easier for each party to determine a precise value of what is being exchanged.

The plan above gives a patient “skin in the game” whenever she makes a decision about utilization.

Patient and doctor have complete freedom to pair and unpair as they wish. There will no inertial force from the presence of a subscription plan to interfere with the doctor-patient relationship.


The patient gets to use HSA funds, today. The plan above is fullly consistent with existing law and its policy rationale; a subscription plan is not.


Precisely because this plan beats subscription plans on freedom, transparency, and “skin in the game”, this plan is likely to lower your patient’s total costs better than a subscription plan — even if your patient does not have an HSA.


The specific fees and fee-setting methods will be disciplined by market forces. Some providers, for example, might find that the increased administrative costs of a risk-adjusted fee are warranted, while other stick with simpler models. Importantly, forgoing subscription fees should reduce the market distortions that arise when contracts that allocate medical cost risk between parties.

Health care economics has lessons about cherry picking, underwriting and death spirals, dangers associated with increased costs. These dangers have palpably afflicted health insurance contracts. Subscription service vendors are not immune. A subscription-based PCP unwilling to pick cherries will be left with a panel of lemons.

HDHP/HSA plans were created as a countermeasure to the phenomenon described by Pauley in 1968 , that when “the cost of the individual’s excess usage is spread over all other purchasers of that insurance, the individual is not prompted to restrain his usage of care“. A state legislature declaring that subscription medicine “is not insurance” does nothing to check the rational economic behavior of a DPC subscriber with no skin to lose when seeking her next office visit.


Some who generally do subscription medicine have, for years, also used per visit fees like those suggested above to address concerns about HSA accounts. In fact, one of the more widely touted self-studies by a direct provider, Nextera’s whitepaper on Digitial Globe, supported its claim of downstream claims cost reduction by comparing traditional FFS patients and a “DPC” population that included a significant proportion of per visit flat rate patients. Although Nextera claims that its study validates “DPC”, it presented no data that would allow determination of which DPC model – subscription or flat rate – was more effective.


In fact, before the end of March 2020, several DPC practices responded to the pandemic by offering one-time flat-rate Covid-19 assessment to non-members, such as non-subscribed children or spouses of subscribed members. Those flat-rated family members would have been able to use HSA funds for that care in situations in which the actual members might well have been unable.


I urge the rest of the no-insurance primary care community to reconsider its insistence on a subscription system that simultaneously reduces the ambit of “skin in the game” and cuts off the access of 23 million potential patients to tax-advantaged HSAs. There’s a better way — less entangled with regulation, less expensive, more free, more transparent, and even more “patient-centered”.


UPDATE: IRS showed in recent rulemaking process that it fully believes DPC subscription fees are, by law, a deal breaker for HSAs, despite the president* signalling his favor for DPCs. In my opinion, IRS would prevail in court if it cared to enforce its view. Philip Eskew of DPC Frontier is 100% correct that the odds of the IRS winning on this are closer to 10% than they are to 1%, just not in the way he apparently meant it.